
We have reviewed data for sales of homes in 5 towns in Southeastern Connecticut including Groton, Stonington, Mystic, Ledyard, and North Stonington, and we compared this data to equivalent data in the larger New London County. This is quarterly data for the 5-year period extending from the 4th quarter of 2011 through the 3rd quarter of 2016.
The first chart below shows a couple of things about residential sales activity in New London County.
The uppermost “DOM” line plots the average number of “Days on (the) Market” for homes in New London County prior to sale, and the straight line is a “linear trend line” for that plot – courtesy of MS-Excel. It suggests that the number of days a home remains listed prior to selling over the past 5 years has dropped from roughly 4 months to approximately 3 months.
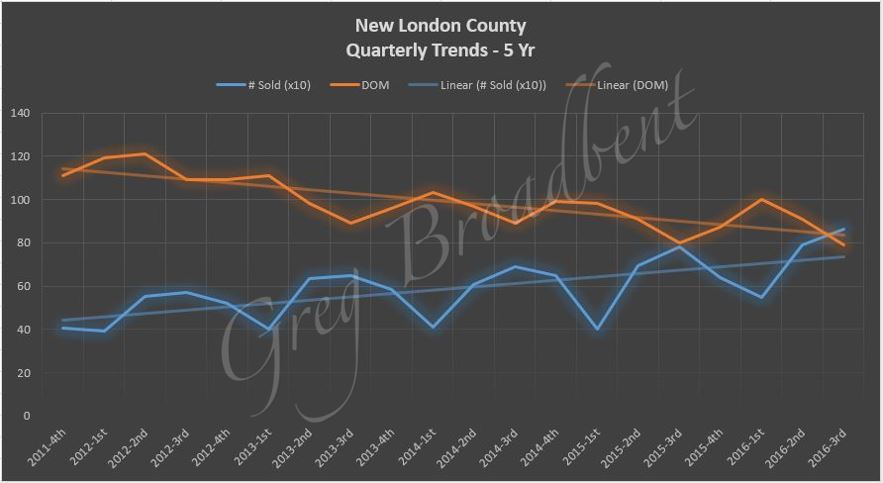
The lower “#Sold (x10)” plots the average number of homes sold per quarter (divided by 10 in order to make the plot more compact) in New London County. Again, the straight line through it is a “linear trend line” for this data – courtesy of MS-Excel. This trend line suggests that over the longer term, the average number of homes sold per quarter in the county has increased significantly, from a little over 400 (40 x 10) to a bit under 800 (80 x 10) over the 5-year period with 1st quarter sales being weaker than sales in the other quarters, as might be expected.
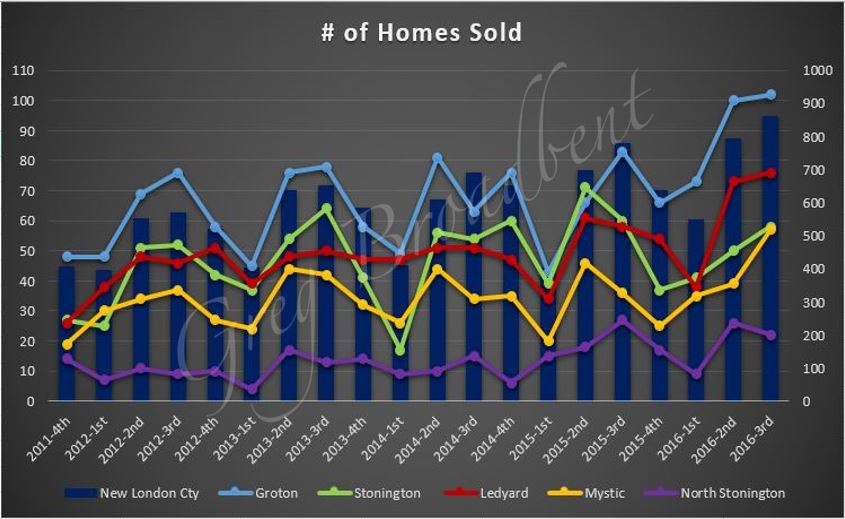
The two charts below show the same data for the five (5) Southeastern CT towns.
The chart to the left below shows the number of homes sold per quarter for each of the towns over the same period; for reference, the New London County data are shown in columns in the background. The sales in each town roughly follow the same pattern where the sales are weaker in the 1st quarter of the year, followed by stronger sales in subsequent quarters.
|
|
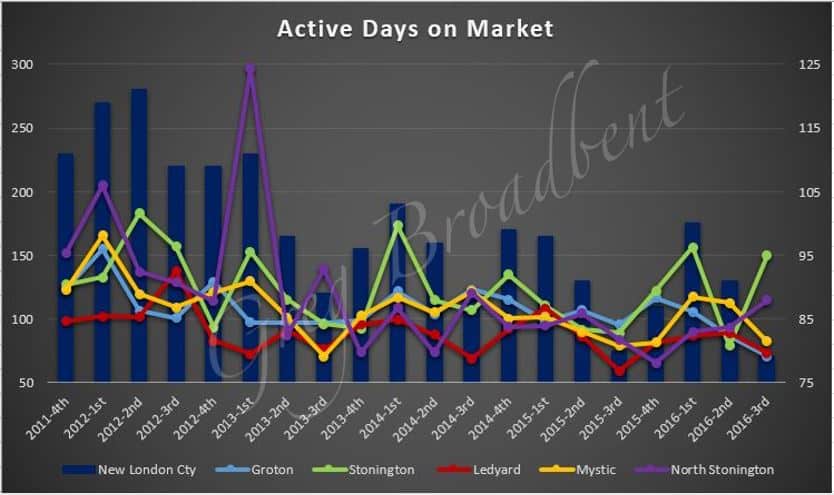
The chart to the right above shows the average number of days homes were listed per quarter for each of the towns over the same period, again with the New London County data shown in columns in the background. With some exceptions, and a couple of them very recently, the average ADOM for homes in this set of SE CT towns is typically less than the averages for New London County as a whole.
In the chart below, average and median closing prices are plotted per quarter for homes sold in New London County in the 5-year period running from the 4th quarter of 2011 through the 3rd quarter of 2016. Again, “linear trend lines” from MS-Excel are provided for this data as well.
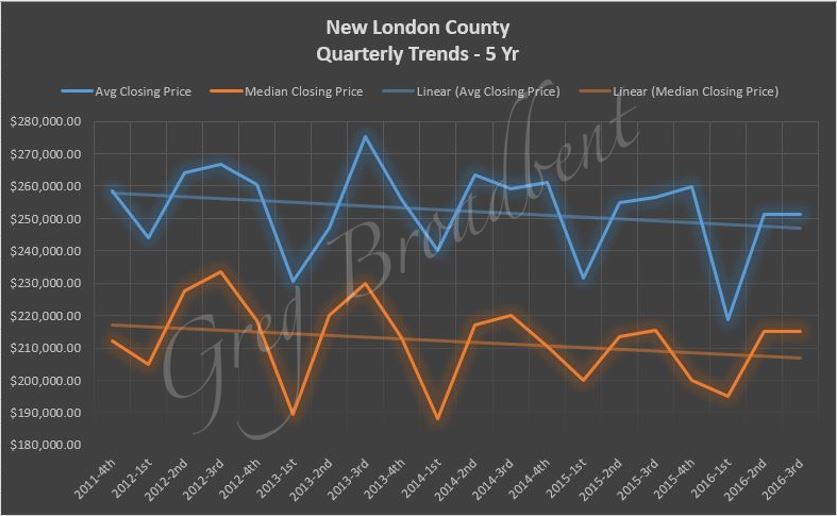
This suggests that overall, both measures – average closing price and median closing price – are trending downward overall. Although the closing price is influenced by many factors which are not reflected in this data, the data suggests that the lowest median and average closing prices are seen in the 1st quarter of a year. The data also suggests that the highest median closing prices occur in the 3rd quarter each year although the average closing prices don’t always rise and fall as the median price does in the other quarters.
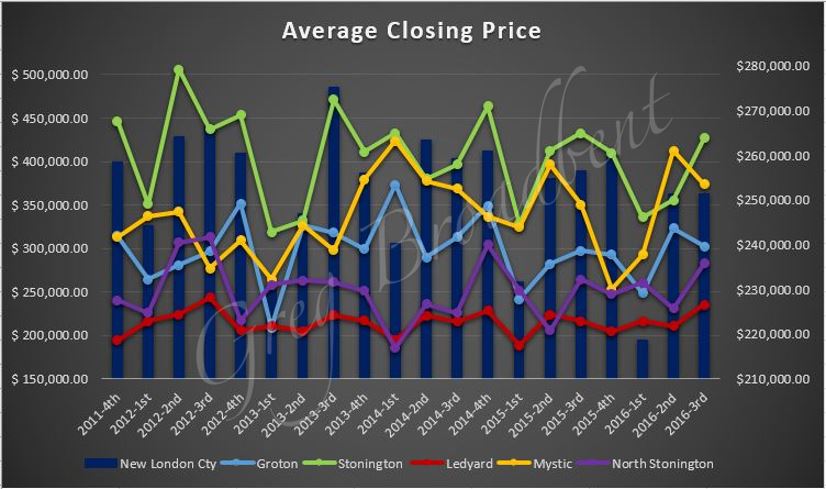
The charts below provide some data about closing prices for the 5 towns in Southeastern CT included in this review.
The chart to the left below shows average closing price per quarter for homes sold in each of the towns over the same period; for reference, the New London County data is shown in columns in the background. Note that the range for the New London County averages is narrower than for the 5 SE CT towns, and the average closing prices in all 5 towns tends to be similar to or greater than the average prices for the larger New London County.
|
|
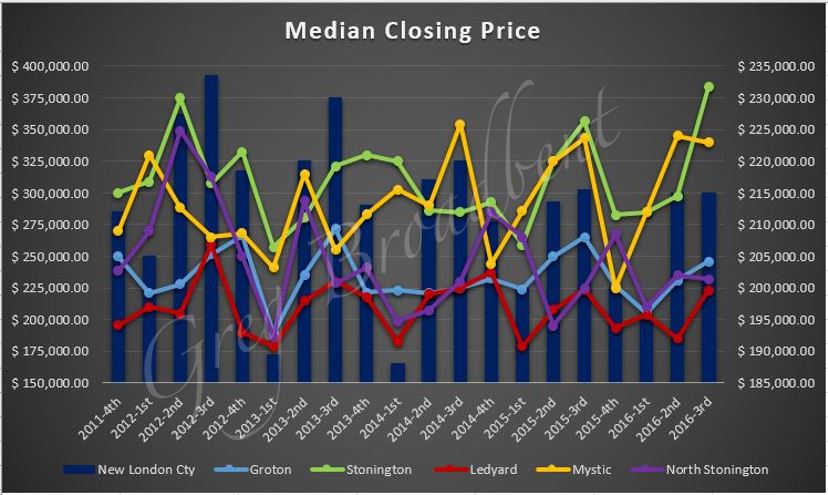
The chart to the right above shows the median closing price per quarter for homes sold in each of the towns with the New London County data shown in columns in the background again. As with the average closing prices, note that the range for the New London County medians is narrower than for the 5 SE CT towns. The median closing prices for all 5 towns tends to be similar to or greater than those for the larger New London County as was the case above as well.
We’ll continue to watch the residential property market and bring you additional observations and data in future blogs.
The New London County data was taken from the Eastern Connecticut Association of Realtors site, and the local data reported above was based on data obtained from the CTMLS as of 10/14/2016. If you are looking for homes for sale in Southeastern Connecticut or if you would like to work with a CT Realtor in the area, please contact us today. We would love to help you buy or sell your next home.

