
There were 85 homes listed for sale by local Realtors in Mystic as of October 3rd. This includes properties on both the Groton and Stonington sides of the Mystic River where 65 and 20 homes were listed respectively. Of the 85 homes actively listed on October 3rd, 65 were also actively listed on September 1st and 39 of them were actively listed 3 months ago on July 1st as well. In September, 11 new listings were added from Groton and 2 from Stonington for a total of 13 new listings for Mystic.
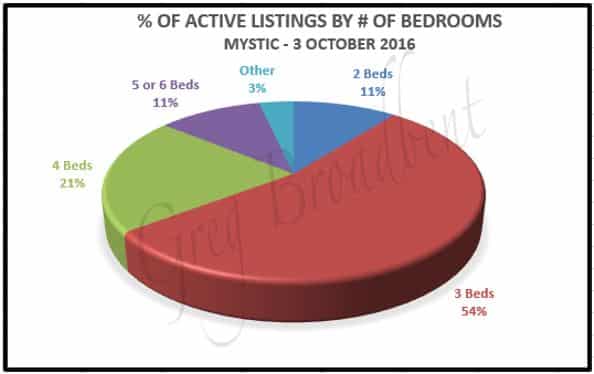
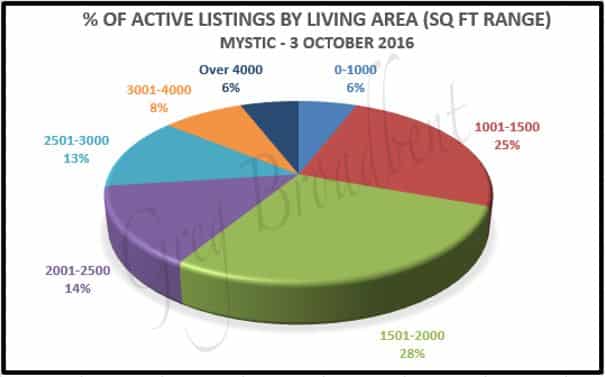
The size of the average house listed for sale in the overall Mystic area was around 2160 square feet with 3.4 bedrooms and 2.2 full bathrooms; 42 (~ 50%) of these 85 homes have at least one half-bathroom. The following chart gives some additional detail on the breakdown of houses available by number of bedrooms and ranges of living area across both areas of Mystic.
|
|
Looking at the Groton part of Mystic, the average living space was a little lower than for Mystic overall at 2045 square feet, but the Stonington part of Mystic is significantly larger at 2540 square feet. The average number of bedrooms and full bathrooms was about the same as the average for Mystic overall. In the Groton area of Mystic, 34 (~52%) of the 65 homes listed have at least one bathroom. In the Stonington area of Mystic, 8 (40%) of the 20 homes listed have at least one bathroom.
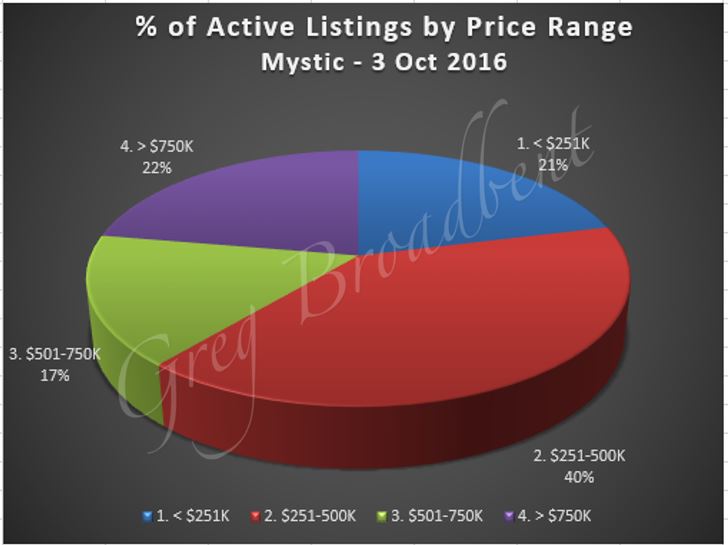
Across all of Mystic, the average listing price was a little over $627,500. Prices ranged from $179,900 to $3,200,000; $399,900 was the median list price. The chart below gives a percentage breakdown of homes listed in different price ranges across all of Mystic.
The average listing price on the Groton side of Mystic was just under $480,000 with the median price at $378,500 while the respective prices were a little under $1,110,000 and $797,000 for the Stonington side.
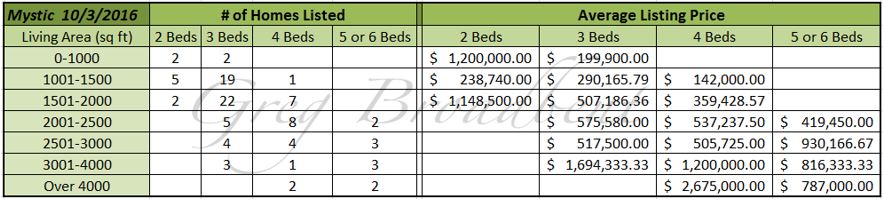
But living area and the number of bedrooms are also related to the asking price. The following chart shows how the average listing price varies with number of bedrooms and living area, and shows the number of houses listed in each category, across all of Mystic.
There were 15 homes under deposit at this time: 14 on the Groton side of the Mystic River and only 1 on the Stonington side. The average price for these homes was just under $334,000 with the other averages at about 1700 square feet, 3.5 bedrooms, and 1.7 full bathrooms; 9 (60%) of them had at least one half-bathroom. These homes were “Active on the Market” for an average of about 99 days with the median at 66 days.
Closing transactions took place for 21 homes in Mystic in September. This brought the total number of closings for 2016 in Mystic to 130, of which 103 occurred for homes on the Groton side of the Mystic River, and 27 for Stonington.
The average closing price for the 21 homes which closed in September was a bit under $376,000. The median price was $297,500 with prices between $158,000 and $1,800,000. The average number of bedrooms was 3.4 and 2 was the average number of full bathrooms. These homes were active on the market for about 115 days on the average, and the median value for this metric was 57 days.
In comparison, the average closing price for the 130 homes which closed in 2016 thus far was a bit over $363,000 with the median value at $321,500. The average number of bedrooms was 3.3 and 2 was the average number of full bathrooms; 66 (~51%) of these homes had at least one half-bathroom. These homes were active on the market for about 101 days on average, and 53 was the median value for active days on the market.
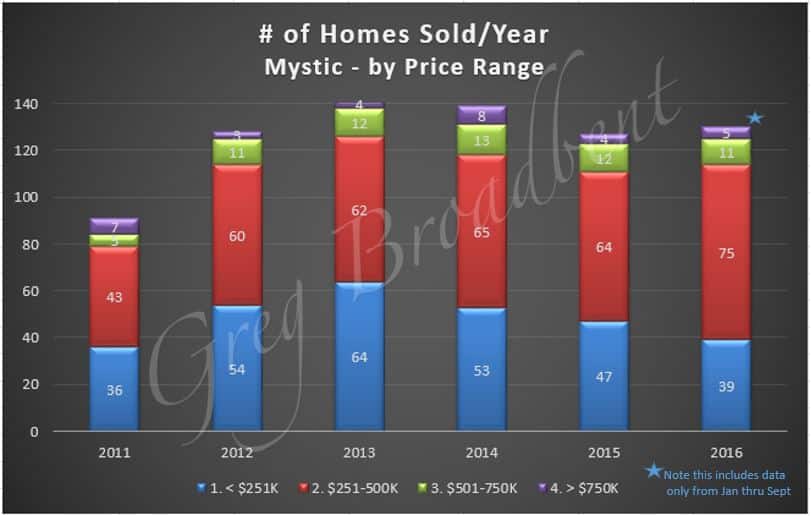
Looking at the longer term, the following chart shows the number of houses sold in Mystic as a whole since 2011 broken down by price range. Note that data for 2016 only includes the months of January through September. The number of houses sold seems to be trending positive, and if activity continues for the 4th quarter as it has for the first three quarters, 2016 will exceed the best previous year in the period – 2013 – in which 142 homes were sold.
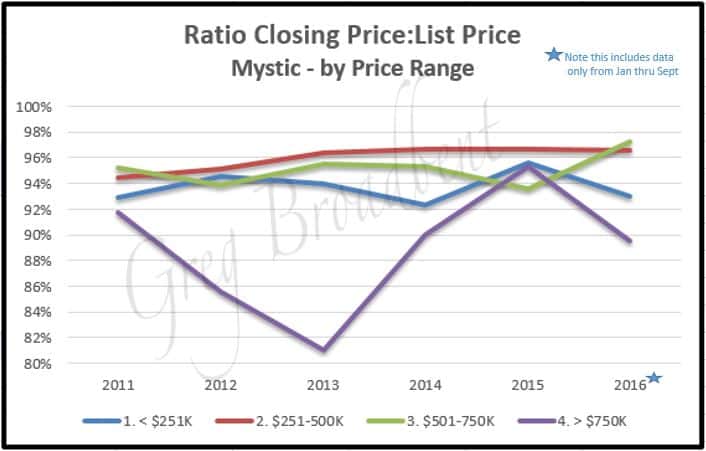
The chart below shows the average of the price paid at closing divided by the listing price as a percentage value. These are displayed by closing price ranges for each year since 2011. Note again that the 2016 metrics include data only for January through September. This suggests that there tends to be less of a difference between closing and listing prices for those homes in the range of $251,000 to $750,000 than those outside that range.
We’ll be monitoring the market over the coming months to see if there are other trends or data of interest which we can share with you in future blogs.
The metrics reported above were based on data obtained from the CTMLS as of October 3rd 2016. Updated information is available from our Mystic Real Estate Page. If you are looking for homes for sale in Mystic or if you would like to work with a CT Realtor in the area, please contact us today. We look forward to helping you find just the right home for you.

