
There were 52 homes listed for sale in Gales Ferry by local Realtors at the beginning of this month on August 1st; this was an increase of 5 over the 47 listings that were active on July 1st. This included 38 properties that were also listed for sale on July 1st as well as 11 that were added in July.
These 52 homes had an average listing price of about $265,000 with prices in a range from $45,000 to $454,900 and median listing price of about $254,000. The chart below provides some additional detail relating the number of bedrooms and range of living area sizes to the listing price for these homes.
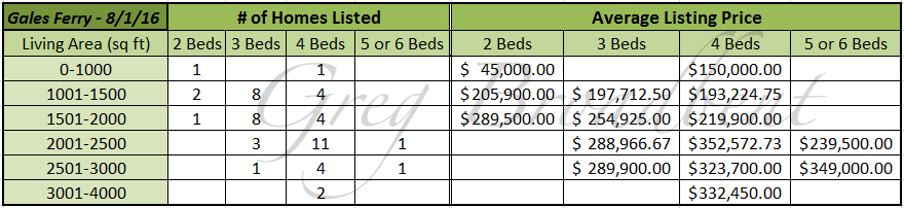
Although these homes had an average size of almost 1930 square feet, the living area varied widely from 882 square feet to over 3775 square feet. Number of bedrooms varied from 2 to 5 with an average at 3.5 bedrooms. These homes had from 1 to 4 full bathrooms with 2 as the average; and 30 of these 52 homes had at least 1 half-bathroom.
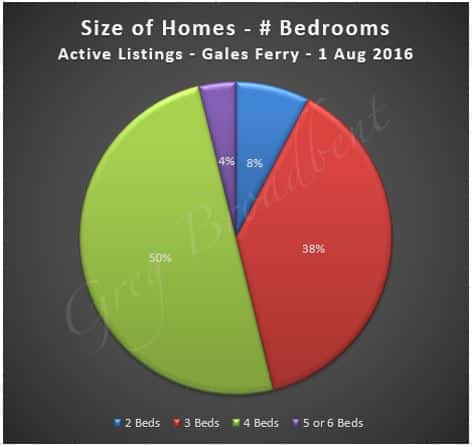
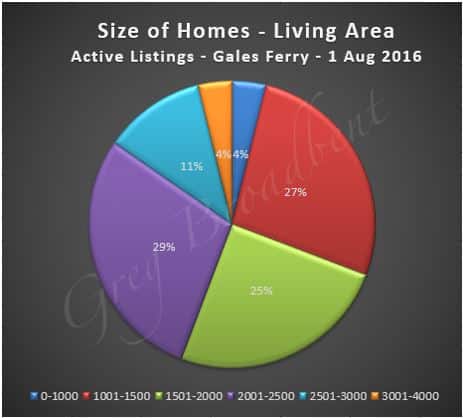
The charts below provide a little more context on the size of the homes actively listed in Gales Ferry as of August 1st.
|
|
11 homes were under deposit as of August 1st with the average size, number of bedrooms, and number of bathrooms being much the same as the averages for those still actively listed. However, the average listing price for these 11 homes was just under $233,000 with prices in the range of $79,100 to $325,000. These homes were listed for an average of 89 days – a little less than 3 months.
There were closing transactions for 12 homes in Gales Ferry in July last month. The average closing price was about $205,500, and the average size of these homes was about 1625 square feet with 3.5 bedrooms. The homes had been listed for an average of 67 days.
This can be compared with closing transactions which occurred for 12 homes also in July of 2015 in Gales Ferry. In that month, the average closing price was close $236,000; the average size was 1864 square feet with 3.67 bedrooms. But these homes had been listed for an average of only 32 days.
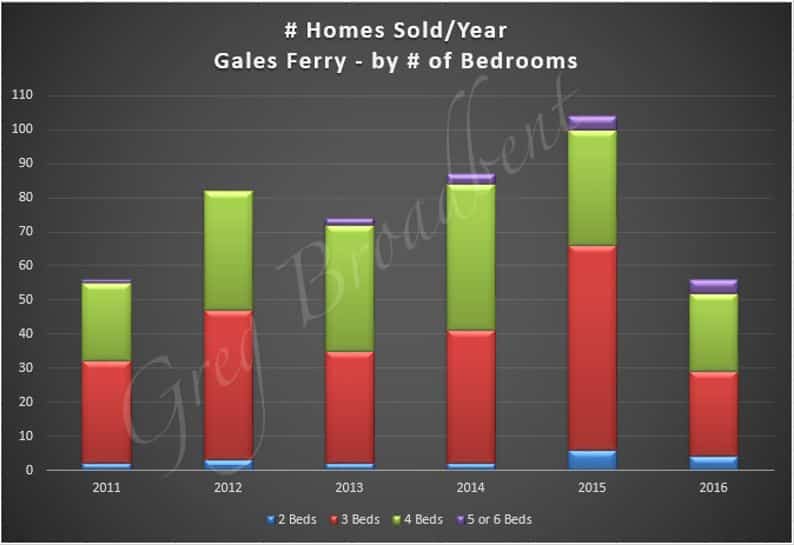
The chart below shows the number of houses sold per year in Gales Ferry since 2011 broken down by number of bedrooms noting that the 56 represented for 2016 reflect only the months January through July.
Information on trends in closing prices is provided in the chart below. It shows a “rolling average” for closing prices of homes sold per quarter in total over the past 5 years since 3rd quarter of 2011. It also shows closings prices broken down by number of bedrooms (for homes having 2-6 bedrooms). It suggests that closing prices have more or less held steady for the past several years.
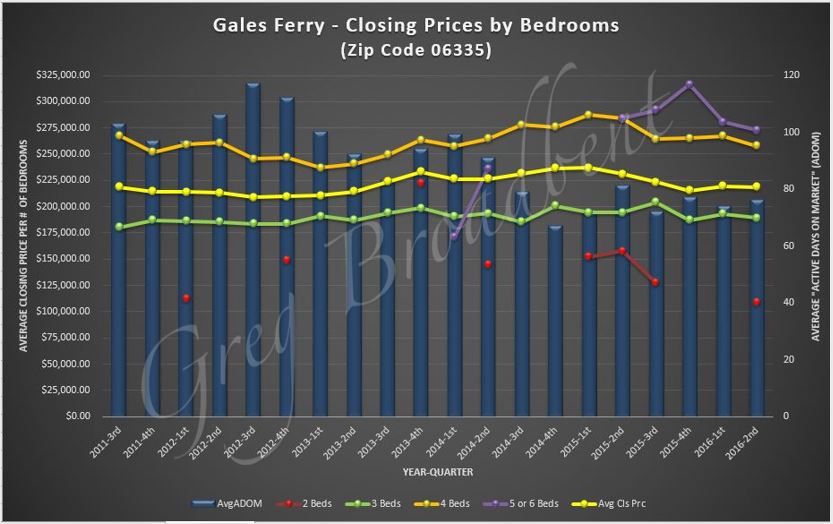
The chart above also shows a 12-month rolling average for “Active Days on Market” for all homes disregarding number of bedrooms, and it suggests that the amount of time required to list a home before it sells is slowly but steadily decreasing over the last several quarters.
We’ll be monitoring the market over the coming months to see if there are other trends or data of interest which we can share with you.
These statistics were based on single family residential home and all data was collected from the CTMLS as of August 1st 2016. Updates will be posted to our Gales Ferry page.
If you are looking for properties for sale in Gales Ferry or if you would like to work with a CT Realtor in this area, please contact us today. We would love to help you buy or sell your next home.

