
There were 53 homes listed for sale by Realtors in North Stonington as of September 1st which is 4 fewer than had been actively listed on August 1st. Of these, 46 were also actively listed as of August 1st, and 16 of these had also been actively listed 3 months ago on June 1st. 6 new homes were added to the CTMLS listings in August for North Stonington as well.
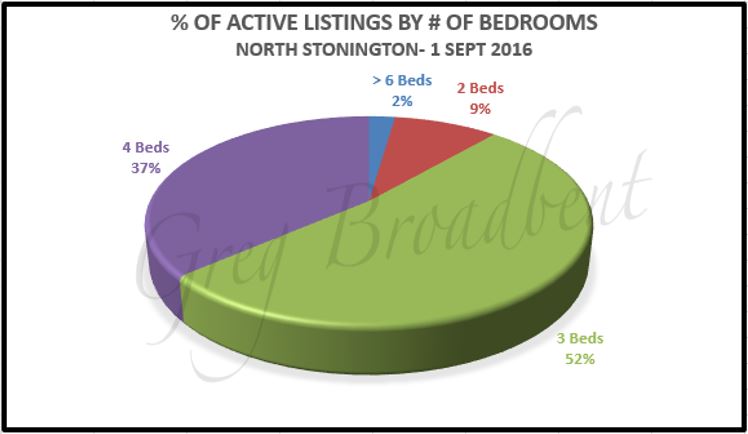
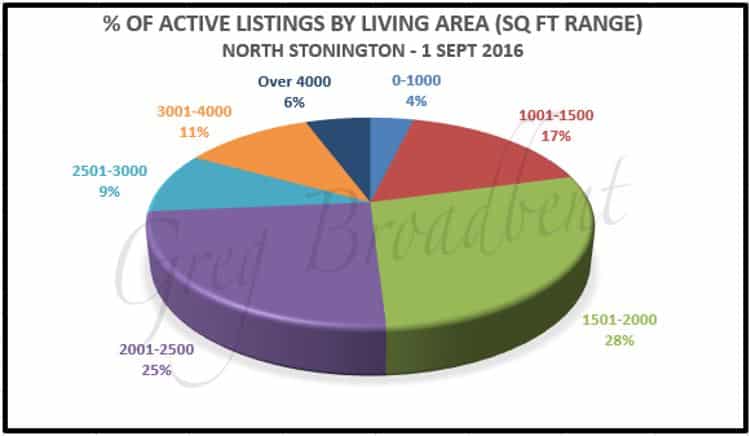
The average size for these 53 homes is around 2200 square feet with the range going from 720 to 5920 square feet. The number of bedrooms ranges from 1 to 8 and the average is 3.5 bedrooms. The number of full bathrooms also ranges from 1 to 8 but the average is 2.3; 24 of these homes had at least one half-bathroom. The following charts give a little more data about the size-related attributes of these actively listed homes.
|
|
The following charts show what percentage of the homes listed as of September 1st are in each of four different listing price ranges.
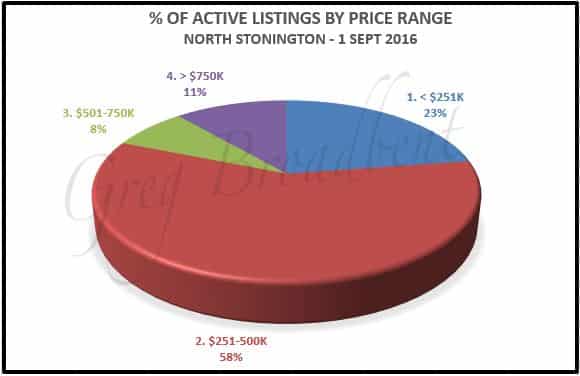
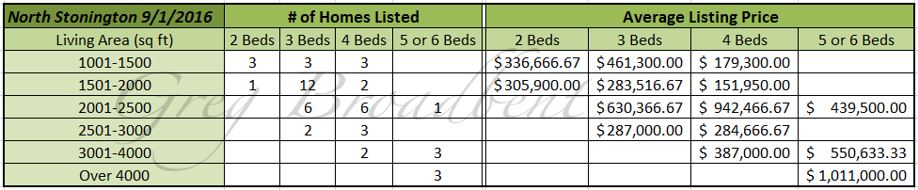
The average listing price for these 53 homes is about $466,000 which is well above the median of approximately $300,000. Prices ranged from a little under $90,000 to $3,950,000. The chart below provides some additional detail relating the number of bedrooms and range of living area sizes to the listing price for these homes with active listings as of September 1st.
As of September 1st, there were also 7 homes under deposit. The average size for the homes under deposit is a little bit smaller than for those that are listed – being about 2050 square feet with 3.4 bedrooms and under 2.0 full bathrooms. The average listing price is about $316,000 with the prices ranging from $175,000 to $599,000 for the homes currently under deposit.
There were closings for 4 homes in North Stonington in August which brought the total number of homes sold in 2016 as of September 1st to 48. The average size for the 48 homes which have closed in 2016 so far was about 1825 square feet with 3.25 bedrooms and 1.9 full bathrooms; 18 of these 48 homes had 1 half-bathroom. These homes averaged being active on the market for 106 days, or about 3.5 months with the median value here being much lower at 58 days, or only about 2 months. The average closing price for these 48 homes was almost $245,000 with prices ranging from $80,000 to $600,000.
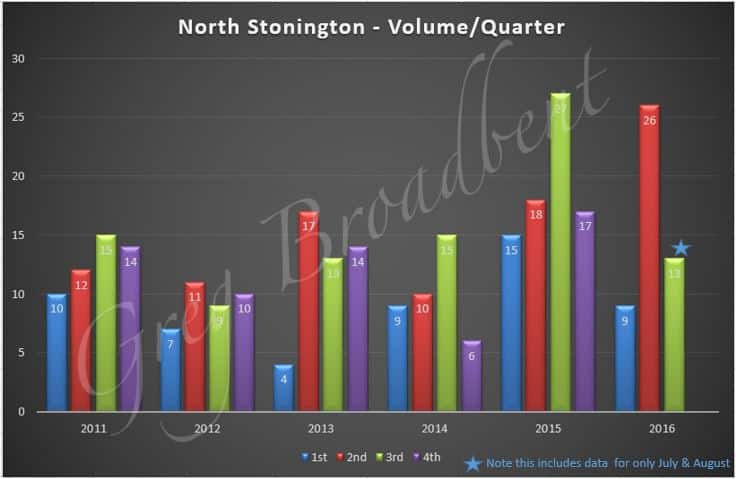
As far as longer term trends go, the following chart shows the number of homes being sold per year by quarter since 2011 – noting that the 3rd quarter 2016 measure includes data for homes sold only in July and August.
The chart below shows a per-quarter 4-quarter “rolling average” of closing prices for homes with 2, 3, 4, and 5-6 bedrooms as well as an overall average for the 5 years between 3rd quarter 2011 and 2nd quarter 2016. It suggests that closing prices have been more or less holding steady.
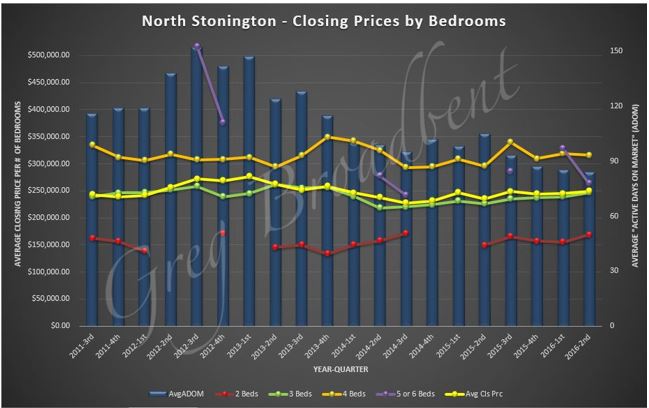
Noting the background bars in blue, the chart is also showing a per-quarter 4-quarter “rolling average” for the number of days listings stayed active on the market for the five years between 3rd quarter 2011 and 2nd quarter 2016. This suggests that the amount of time a home remains listed before being sold has decreased significantly since 2012.
We’ll continue to watch the residential property market and bring you additional observations and data in future blogs. The data reported above was based on data obtained from the CTMLS as of 9/1/2016. Updated information is available on our North Stonington Real Estate Page.
If you are looking for a house in North Stonington or if you would like to work with a Realtor in the North Stonington area, please feel free to call us. We look forward to helping you find just the right home for you.

