
As a person ponders a commitment to buying or selling a home, he or she will likely want to learn a little bit about activity in the local market. The postings in this blog are intended to assist the prospective buyer or seller by providing such information.
While the data reported in these blogs are not intended to predict future market activity, there are a number of factors related to the listing and sale of homes which can be used to discern patterns of past activity which might be informative.
The factors which we monitor and the related measures used are described below.
Number of active listings: A listing represents a contract between a seller and a real estate agent to promote the sale of a home using CT Multiple Listing Services. The number of homes being actively listed changes every day as new listings come on the market, so we take a “snapshot” copy of data for all active transactions on the 1st business day of the month, and this data is used in analysis of “Active Listings”.
Number of closings (or closing transactions): The number of homes for which the sale or “closing transaction” is completed in a period of time, usually within a given month or a given quarter.
Closing Price: The final sales price paid by the buyer to the seller in exchange for the home at the time of the closing.
Listing Price: The price the seller is asking a buyer to pay in purchasing the home; it is not uncommon for the seller to lower the price over the term of a listing to make it more attractive.
Active Days on Market: The total number of days the house has been advertised on the open market; I have posted a Real Estate Blog which discusses this topic in more detail.
Closing Price/Listing Price %: The price agreed for the sale of a home often is different from the asking/listing price, this percent measure indicates the difference based on the listing price.
There are also a number of statistical-type measures which we routinely report as well which are described below.
Average: This is also known as the “mean” – just the sum of all the values in a set (e.g. the set of closing prices for homes in a town like Groton for a specific period of time such as the month of June in 2015) divided by the number of values in the set.
Range: The highest and lowest values in a set, also known as the “Max” and “Min”.
Median: The value in a set exactly in the middle; the value where there are the same number of values below AND above that value in the set. If the set has an even number of values in it and there is no one value “in the middle”, then the median value would be the average of the two middle values.
Rolling Average: A “rolling average” is used in order to moderate and smooth out fluctuations and extremes in peaks and troughs that are often seen in data reported over a shorter time period. The rolling average used most often in this blog is a one year quarterly “rolling average” which reflects the average for the values in the given quarter and values reported in the preceding three quarters as well.
In order to assess how attributes of homes might influence sales, factors such as ADOM, closing price, and the Closing Price/Listing Price ratio are calculated for different attributes or combinations of attributes including:
– Living Area Ranges (by square feet)
– Number of Bedrooms and Bathrooms
– Listing Price Ranges
– Location (e.g. Town or Zip Code or “Neighborhood” such as Noank)
– Date Ranges – monthly, quarterly, and/or annually
Finally, in addition to the specific measures we cite in the blogs themselves, we also include some graphical presentations to help impart some of the context of the data under review. These include:
Charts: These are used to organize data so that it is easy to compare the effects of different attributes. One frequently used type of chart is shown below.
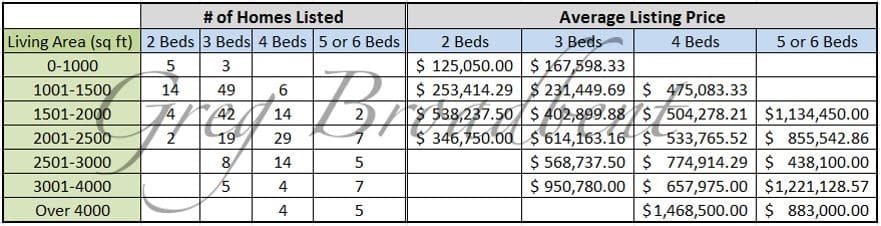
In addition to an overall average listing price routinely cited in the text, this chart provides additional detail. It shows how many homes are listed with different combinations of bedroom and living area attributes. This chart also includes the average listing price for homes with the corresponding attribute combination.
Line Charts: The lines in these charts are usually used to highlight changes in a measure over time. Often expectations about measures in the near-term future are based on data seen in this type of chart. BUT these types of displays are NOT intended to predict what will happen in the future.
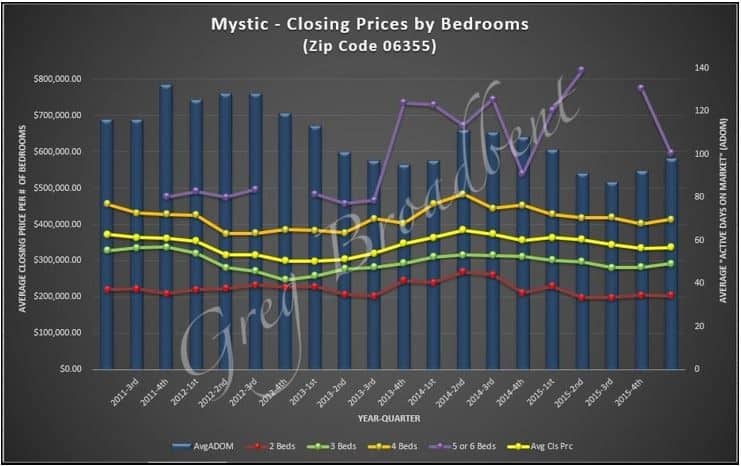
The chart below uses “rolling averages” to report an “average” closing price independent of the number of bedrooms to start. Specific rolling averages for closing prices for houses with the given number of bedrooms is included. A “rolling average” for “Active Days on Market” is also indicated on a background bar-chart!
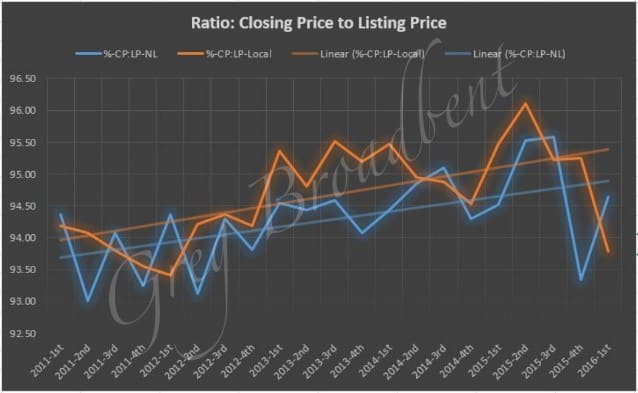
The next chart shows lines for the average percent values of closing price divided by listing price for homes having closing transactions in the corresponding periods. But a linear “trend line” calculated and reported using an MS-Excel feature is included in this chart also to provide one possible interpretation of the variations in the data.
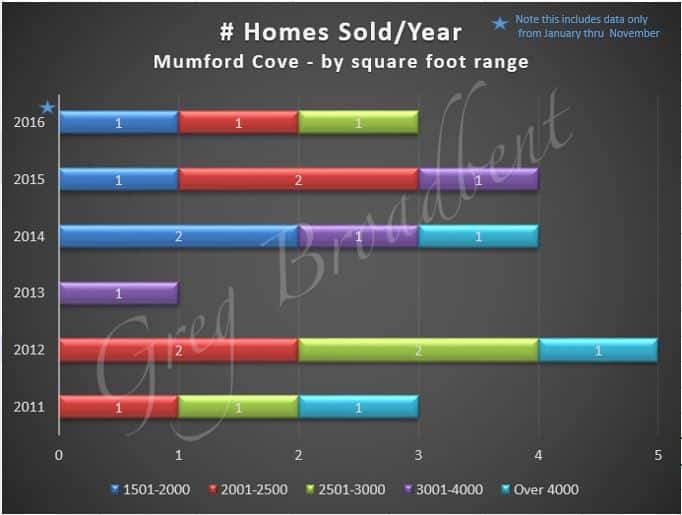
Bar Charts: These charts are also used to make comparisons of the same measure broken down by an attribute value.
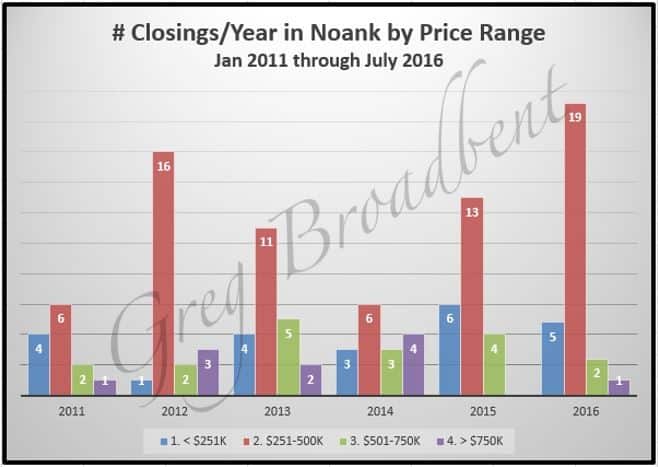
In the following chart, we are interested in the number of closings – completed sales transactions. However, the data is reported both by year and by price range to give us more insight into attributes which might be influencing the number of sales which complete.
The data in this next chart provides the same sort of information, but in a slightly different format and using a different attribute – range of living area. This is more useful given that there are fewer data points to report in this chart.
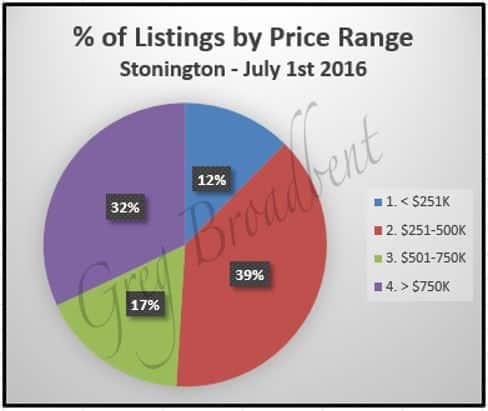
Pie Charts: Used simply as a visual aid to help “see” the difference between percentages which add up to 100 as illustrated in the chart below.
We will continue to monitor market activity in Southeastern Connecticut over the coming months. We will share trends or other data of interest with you in future blogs using the approaches described above.
If you are looking to purchase a home in the area or to work with a local real estate agent, please feel free to call us. We look forward to helping you find just the right home for you.

