
In summary, there were 124 homes listed for sale by Realtors in all of Groton including Groton Long Point, Noank, Mumford Cove, and the Groton side of Mystic as of February 1st. This is 6 fewer than the 130 homes which were actively listed on January 3rd. 90 of these homes were actively listed a month ago on January 3rd as well. Also, 56 of them were active 3 months ago on November 1st. There were 11 homes under deposit on February 1st. Finally, there were 27 closings and 31 new listings added for Groton in the CTMLS in January.
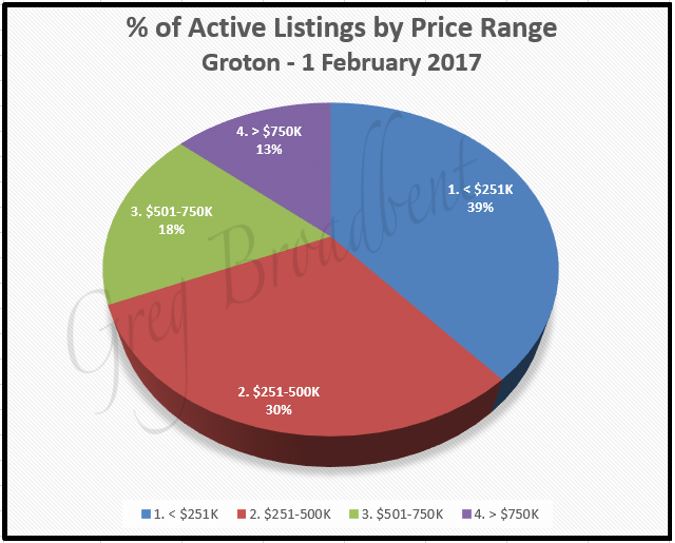
Listing prices ranged by two orders of magnitude from $35,000 to $3,200,000 for homes actively listed in Groton on February 1st. The average listing price was a little over $475,000. However, the median listing price of $364,000 was significantly lower than the average. The chart below gives a percentage breakdown of homes listed in different price ranges across Groton.
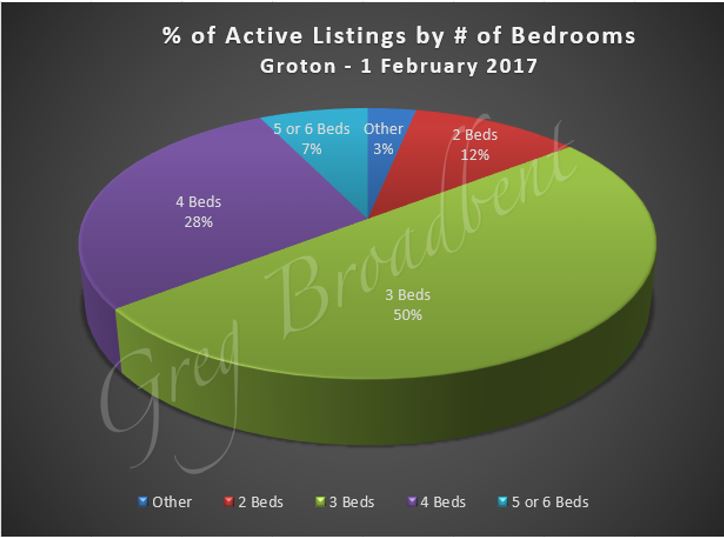
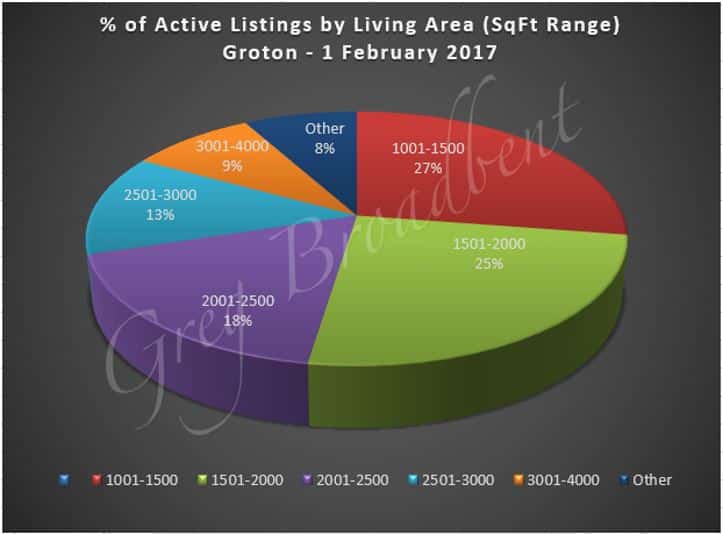
The average size for the 124 actively listed homes is a bit over 1950 square feet. These homes ranged in living area from just over 500 to just over 5750 square feet. The median living area was 1745 square feet. The homes offered from none to 9 bedrooms with 3.3 as the average. The average number of full bathrooms was 2. 58 (~47%) of these homes also had one or two half-bathrooms. The following charts provide some information about the attributes of the actively-listed homes.
|
|
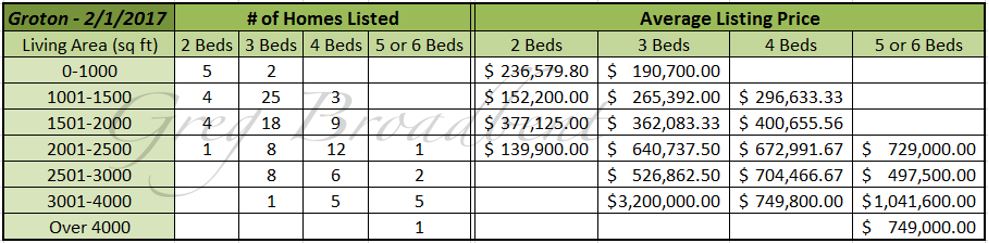
living area and number of bedrooms are also related to the asking price. The following chart provides a count of the actively listed homes in Groton by number of bedrooms and living area range. It also shows the corresponding average listing price for those categories.
There were 11 homes under deposit as of February 1st as well, 9 fewer than were under deposit on January 3rd. The average listing price for these homes is just under $295,000. Prices for these homes were in a range from $135,000 to almost $670,000. The average size for these homes was just over 1550 square feet with 3.4 bedrooms and 1.6 full bathrooms. The listings for these homes had been active for an average of 73 days, not quite 2½ months.
There were closing transactions for 27 homes in Groton last month in January. This was 4 more than closed the previous January in 2016. The average closing price for these 27 homes with January 2017 closings was a little over $260,000. The average size for these homes was about 1600 square feet. They had an average of 3¼ bedrooms and 1¾ full bathrooms. The listings for these homes had been active for an average of 105 days, or about 3½ months.
In comparison, 79 Groton homes had closings in the last 3 months of 2016. The closing prices for these homes were in a range from almost $45,000 to $1,335,000. The average closing price was a little more than $315,000. $259,000 was the median closing price. These homes had between 2 and 7 bedrooms with the average at 3.4 bedrooms. There were between 1 and 5 full bathrooms with 1.7 as the average. 43 (~54%) of these homes included one or two half-bathrooms as well. These listings were active for an average of 95 days – about 3 months. The median period for the metric was 62 days – just about 2 months.
For additional comparison, there were closings for 353 homes for all of 2016. Closing prices ranged broadly from $13,000 to $2,100,000. The average closing price was just over $300,000 and $235,000 was the median closing price. These homes offered between 1 and 8 bedrooms with an average of 3.3 bedrooms. In addition, there were between 1 and 5 full bathrooms. The average number of full bathrooms was 1.8 and 154 (~44%) of these homes offered between one and five half-bathrooms as well. These listings were active for an average of 88 days – almost 3 months. But the median period was only 51 days.
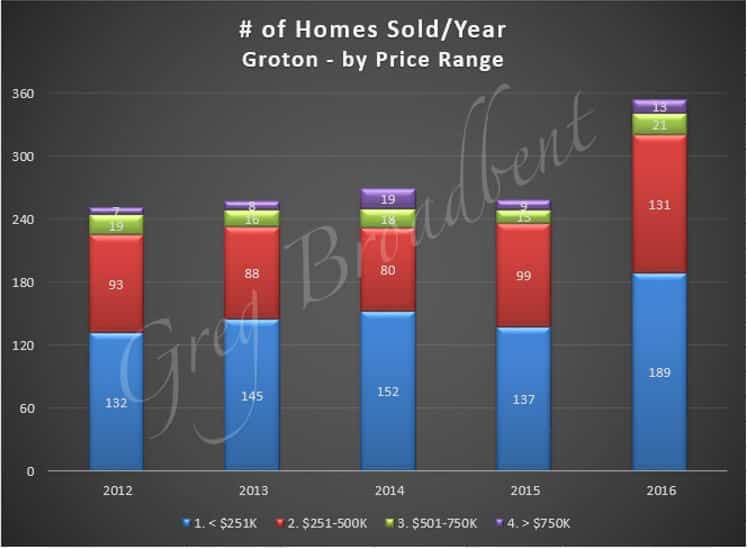
As far as longer term trends go, the chart below shows that the number of homes sold increased markedly in 2016 after holding more or less steady for the previous 4 years. Also, the increase was from 30% to 60% over the prior year in each of the 4 price ranges.
Next, the chart below shows a 12-month quarterly “rolling average” of closing prices for homes with 2,3,4 and 5-6 bedrooms as well as an overall average for the same time period. It suggests that closing prices have been more or less holding steady overall and for homes with 2 and 4 bedrooms. While prices seem to have been declining for homes with 5 and 6 bedrooms, the price for a 4 bedroom home seems to have improved in 2016 over the preceding 4 years.
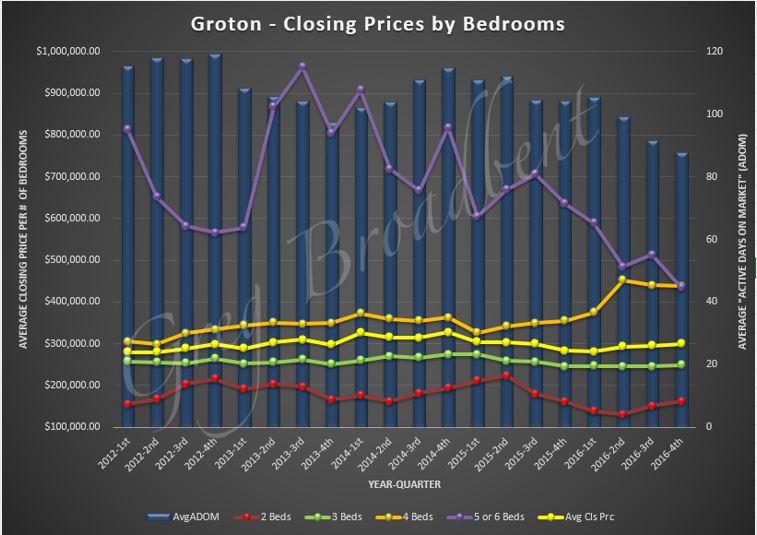
The background bars in blue show a 12-month quarterly “rolling average” for the number of days listings stayed active on the market for the same period. This suggests that the amount of time a listing remains active has been declining since 2012. This means that homes are selling faster now on the average than they were in 2012.
We’ll be monitoring the market over the coming months to see if there are other trends or data of interest. Updates will be posted to our Groton Real Estate Page.
The data reported above was based on data obtained from the CTMLS as of 2/1/2017. If you are looking for a home in the Groton area or if you would like to work with a local Realtor, please feel free to call us. We look forward to helping you find your next home.

