
179 homes were actively listed for sale in Groton by local Realtors as of October 3rd, down 21 from the 200 that were actively listed as of September 1st. Of these 179 homes, 143 had also been listed a month ago on September 1st, and 86 had been actively listed 3 months ago on July 1st as well. There were 34 homes listed as under deposit as of October 3rd, down 1 from the 35 that had been under deposit as of September 1st. There were 39 closings for Groton homes and 32 new listings were added in September.
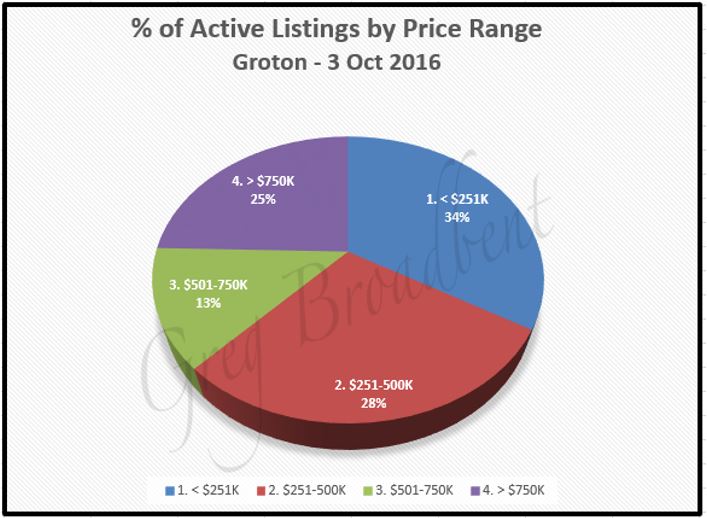
The average listing price for the 179 homes is almost $548,000 although the mean listing price is only $365,000. Listing prices range from just under $45,000 to $3,200,000. The chart below shows the percent of these homes listed in different price ranges.
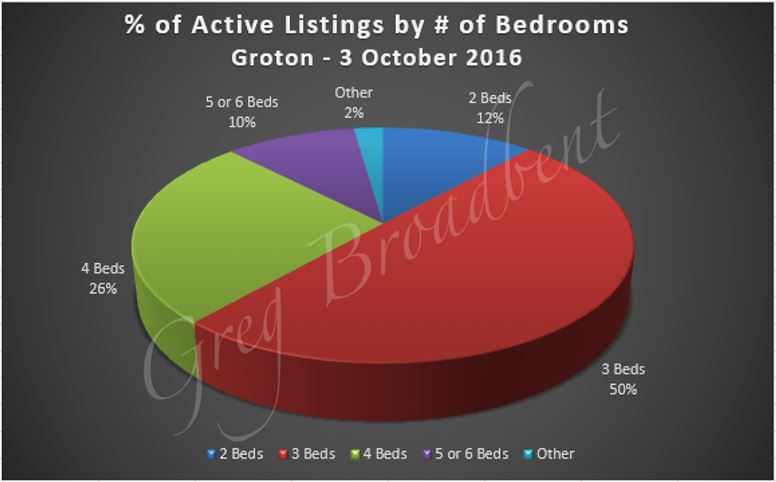
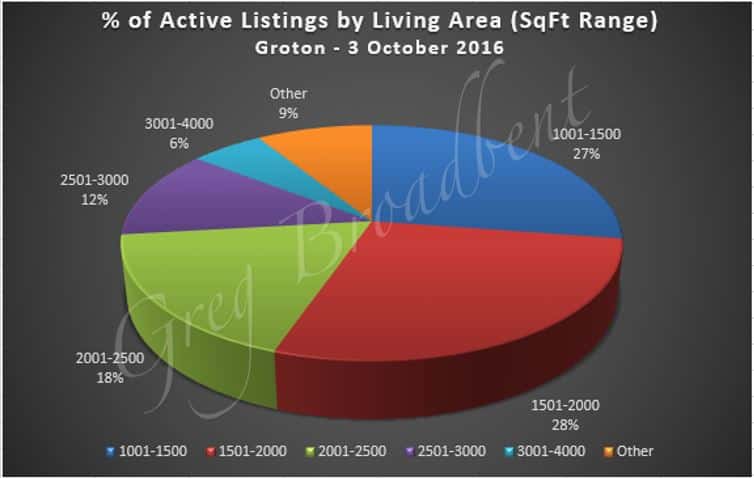
The size of the average house listed for sale in the Groton area was just over 2000 square feet. Living areas ranged from 517 to 5754 square feet with 1800 square feet as the median value. There were up to 9 bedrooms in the houses listed, but the average number of bedrooms was 3.4 and the median was 3 bedrooms. The average number of full bathrooms was 2, and 85 (~47.5%) of these 179 residences had at least one half-bathroom. The charts below provide some additional context for percents of listed homes with different numbers of bedrooms and living area ranges.
|
|
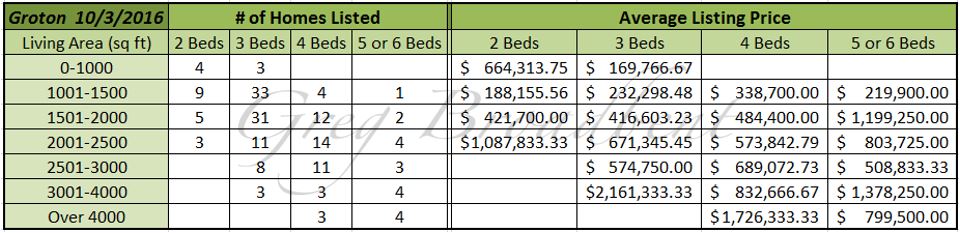
Since prices will vary based on such features as living area and number of bedrooms, the chart below provides some additional detail about the number of homes listed by number of bedrooms and range of living area size, as well as the corresponding average listing price.
There were 34 homes under deposit in Groton on October 3rd. The average price for these homes was slightly over $323,000. Homes under deposit ranged in price from $55,000 to almost $1,600,000 with the median price a bit under $250,000.
These homes had an average size of just over 1700 square feet with an average of 3.5 bedrooms and 1.7 full bathrooms; 19 (~56%) of them had at least one half bathroom. On average, the homes under deposit as of October 3rd were active on the market for about 97 days, just a little over 3 months. However, the median listing duration was only 57 days, or a little under 2 months.
Closing transactions were completed for 39 homes last month in September. That brought the total for the 3rd quarter to 102 and the total for 2016 so far to 275.
For the 39 homes that closed in September, the average closing price was a bit under $325,000 with $245,000 as the median closing price. The average closing price/square foot was about $165.00 where the $153.00 was the median. The average number of days for which these homes were listed was 70, and the median value was 51.
The average living area for these 39 homes was about 1850 square feet with the median at 1600 square feet. They had an average of 3.4 bedrooms and 2 full bathrooms; 16 (~41%) of them had at least one half-bathroom.
These values can be compared to averages for the 275 residential closings that completed in the first three quarters of 2016. The average closing price was just under $296,000 with the median at $232,000. The average closing price/square foot was $160 and $150 was the median value for this measure. These homes were actively listed for an average of 86 days and the median ADOM (active days on the market) value was 46 days.
The average living area for the 275 homes which closed between January and September was about 1750 square feet with the median at about 1600 square feet again. There was an average of 3.2 bedrooms and 1.8 full bathrooms; 111 (~40%) of them had at least 1 half-bathroom.
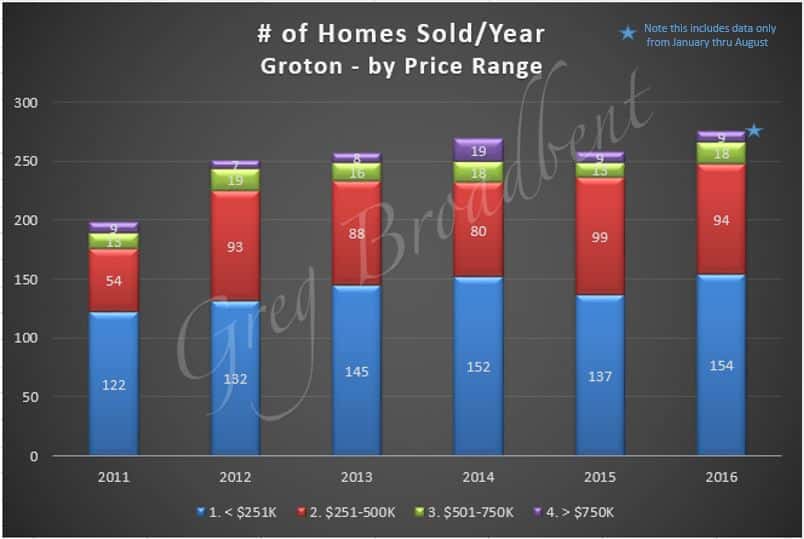
As far as longer term trends go, the graph below shows the number of homes sold per year for each year since 2011 broken down by range of closing prices. This indicates that more homes have sold in Groton this year already than any of the other years since 2011.
Finally, the chart below provides some additional data on closing prices in the longer term. It shows a 4-quarter “rolling average” of closing prices for homes sold per quarter over the past 5 years in total, and broken down by number of bedrooms (for homes having 2-6 bedrooms). It suggests that prices have remained flat overall and for smaller homes. It also suggests that prices have been improving (at least recently) for owners of 4 bedroom homes, but dropping for owners of homes with 5 and 6 bedrooms.
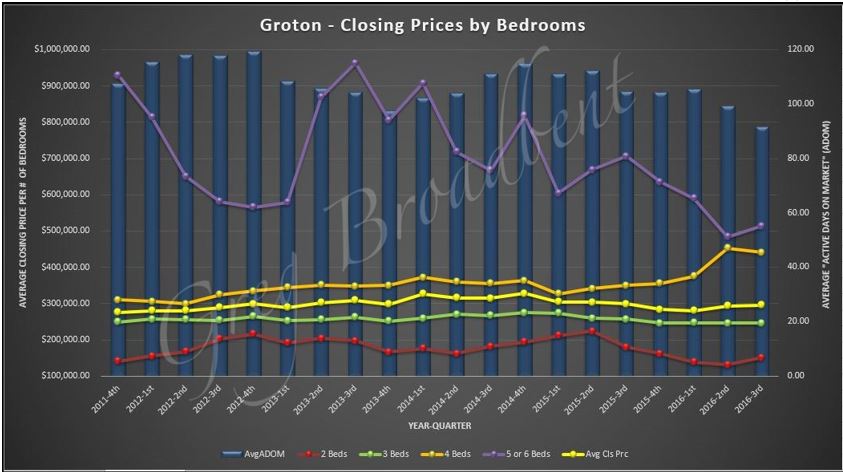
The background bars in the chart above also show a 4-quarter rolling average for “Active Days on Market” by quarter regardless of the number of bedrooms. This suggests that the average time to sell a home has come down from around 4 months in 2012 to be closer to 3 months more recently, and that would be a positive for sellers.
We’ll continue to watch the residential property market in the local area and bring you additional observations and data in future blogs.
The trends reported above were based on data obtained from the CTMLS as of October 3rd 2016 for single family residential properties. Updated information will be posted on our Groton Real Estate Page. If you are looking for a home in the Groton area or if you would like to work with a local CT Realtor, please feel free to call us. We would love to help you buy or sell your next home.

