
There were 106 homes listed for sale by Realtors in all of Ledyard including Gales Ferry as of September 1st; this is slightly lower than the 113 homes which were actively listed on August 1st. 81 of the homes listed on September 1st were active listings on August 1st also, and 23 new listings were added in August.
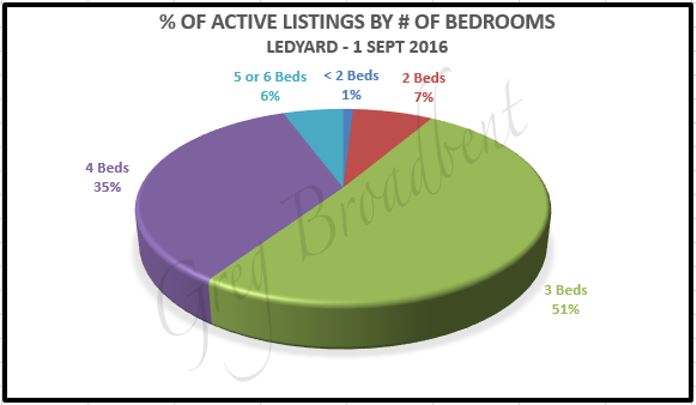
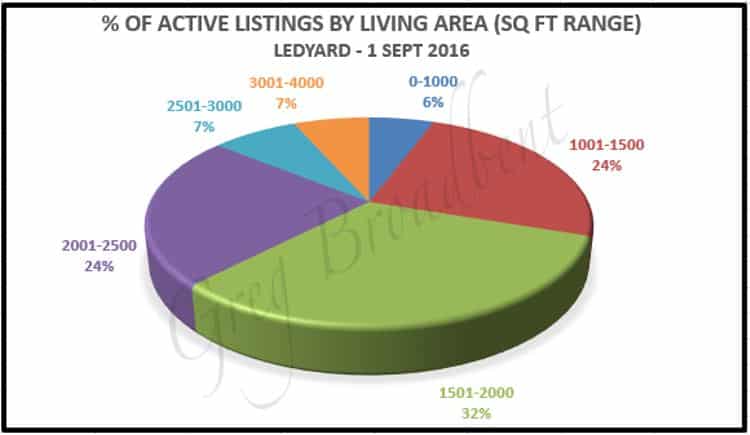
The average size for these 106 homes is just under 1900 square feet with homes in the range 860 to 4000 square feet. Homes had 1 to 6 bedrooms with the average being 3.4 and the median being 3 bedrooms. The average number of full bathrooms was 1.8 with 58 of the 106 homes having at least one half-bathroom.
|
|
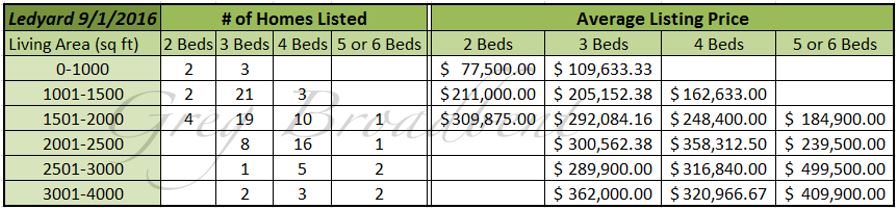
The average price for homes actively listed in Ledyard on September 1st was a little under $275,750 with listing prices in the range $45,000 to almost $670,000 and a median list price just about $1000 over the average at $276,700. The chart below provides some additional detail relating the number of bedrooms and range of living area sizes to the listing price for these homes.
There were 34 homes under deposit as of September 1st as well. The average listing price for these homes is just under $243,500 with prices in the range $89,800 to $389,900. The average size for these homes is just under 1800 square feet with 3.3 bedrooms and 1.88 full bathrooms; 20 of the 34 homes have at least one half-bathroom. These homes had been actively listed for an average of 78 days.
There were closing transactions for 26 homes in Ledyard in August of 2016 as well, which was an increase of 8 over the 18 homes which closed a year ago in August of 2015. The average closing price for the homes which closed in August of 2016 was around $268,500 with an average of 68 days on the market while the average closing price for the homes which closed in August of 2015 was a little under $209,000 with an average of 66 days on the market.
However, the average size of the homes closing in August of 2016 was a little over 2000 square feet with 3.5 bedrooms and 2 full bathrooms while those homes closing in August of 2015 had an average size of a little over 2125 square feet with 3.7 bedrooms and a little under 2 full bathrooms.
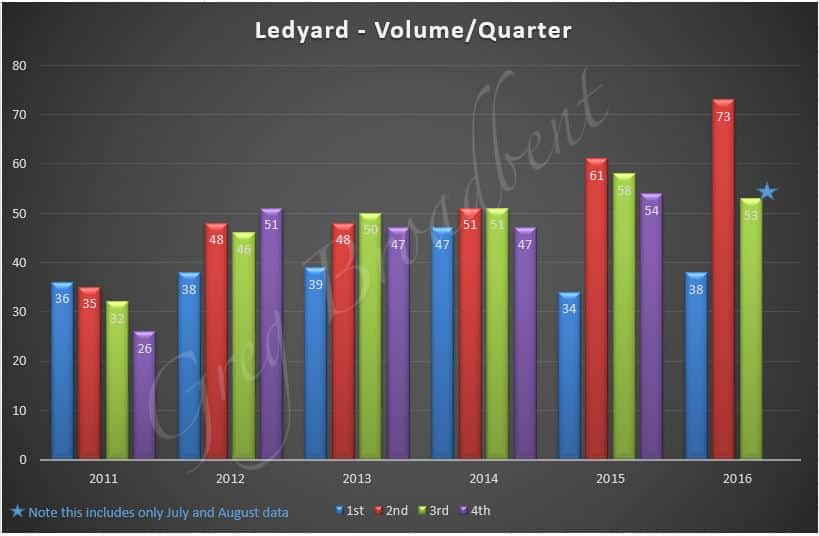
As far as longer term trends go, the chart below suggests that the number of homes being sold each quarter has been slowly but steadily improving year over year since 2011 with the exception being in the 1st quarters. Note that the 3rd quarter 2016 figure doesn’t include data for September – so one can expect the final Q3 2016 number to be higher.
In the chart below, the background bars in blue show a 4-quarter “rolling average” for the number of days listings stayed active on the market for the five years between 3rd quarter 2011 and 2nd quarter 2016. This suggests that the amount of time a home remains listed before being sold is slightly but steadily decreasing.
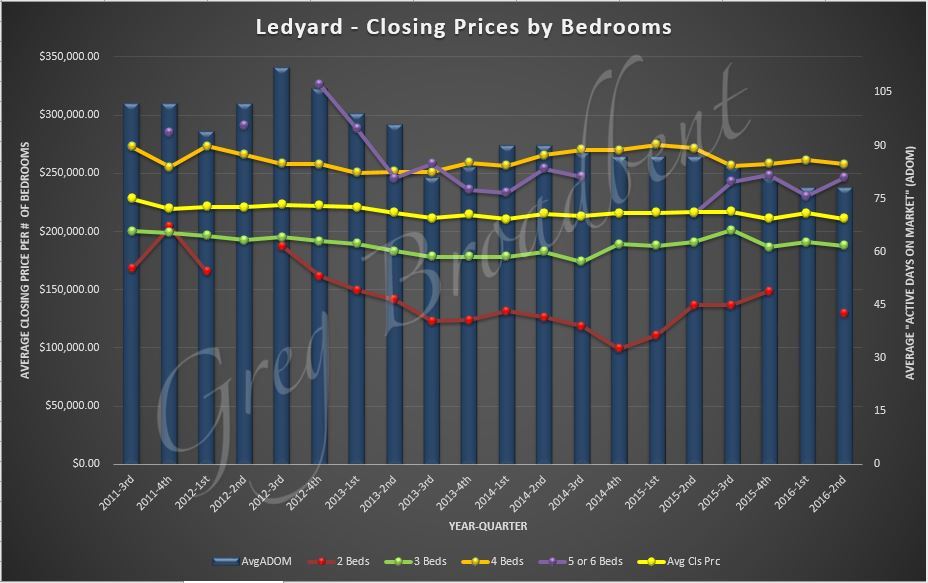
This chart also shows a 4-quarter “rolling average” for closing prices for homes with 2, 3, 4, and 5-6 bedrooms as well as an overall closing price average for the five years between 3rd quarter 2011 and 2nd quarter 2016. It suggests that closing prices have been more or less holding steady for homes with 3 and 4 bedrooms.
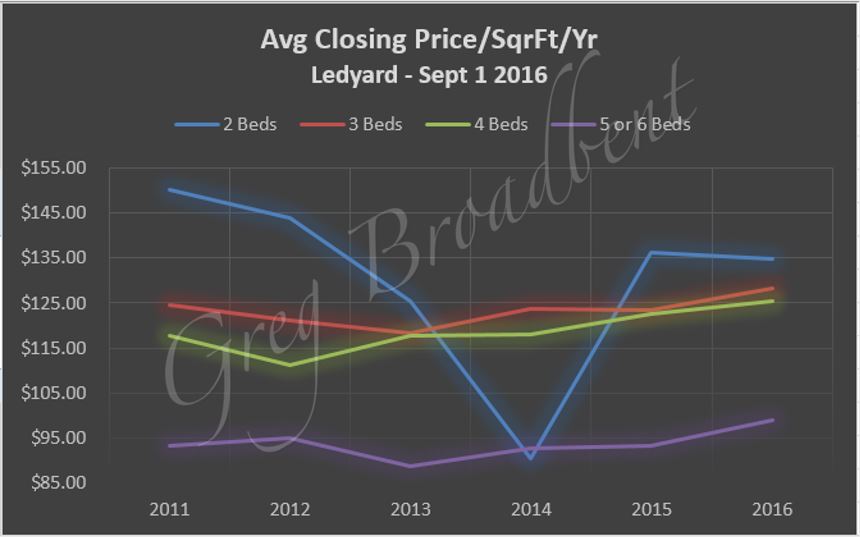
Finally, the chart below shows the average closing price per square foot per year for homes by number of bedrooms noting that the 2016 data is year-to-date. This suggests that the average closing price adjusted for size of homes with more than 2 bedrooms is increasing slightly but steadily.
We’ll be monitoring the market over the coming months to see if there are other trends or data of interest which we can share with you and will post these to our Ledyard Real Estate Page.
The data reported above was based on data obtained from the CTMLS as of 9/1/2016. If you are looking for a home in the Ledyard area or if you would like to work with a local Realtor, please feel free to call us. We look forward to helping you find just the right home for you.

