
Summary
In summary, there were 76 homes listed for sale by Realtors in all of Ledyard including Gales Ferry as of May 1st. This is 7 more than the 69 homes that were actively listed a month ago on April 3rd. Also, 41 of these 76 listings were active a month ago on April 3rd as well. 19 of these were active 3 months ago on February 1st. There were 29 homes under deposit as of May 1st. In addition, there were 16 closings in April. Finally, local real estate agents added 33 new listings to the CTMLS in April for Ledyard.
Active Listings
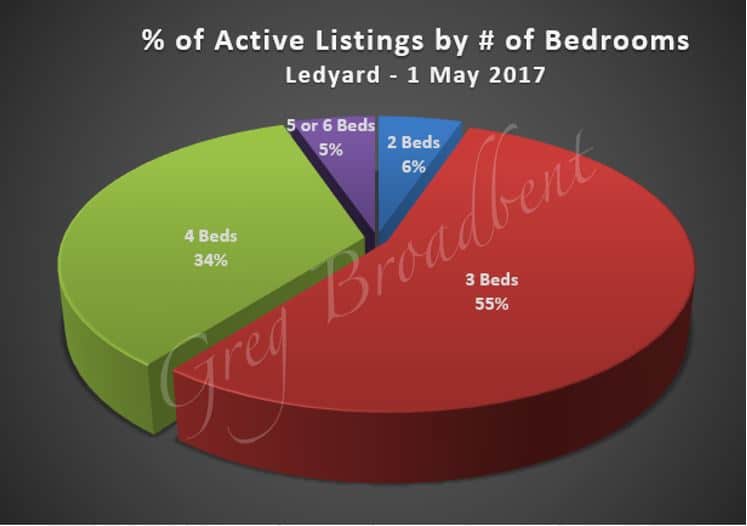
The average size for these homes was about 1850 square feet with a slightly lower median at 1793 square feet. The living areas ranged widely from 825 to almost 3500 square feet. In addition, these homes offered from 2 to 5 bedrooms with 3.4 as the average. The number of full bathrooms included was between 1 and 4 with 1.9 as the average. 45 (~59%) of the 76 homes had a single half-bathroom as well. The following charts provide some additional perspective on attributes of the actively-listed homes.
|

|
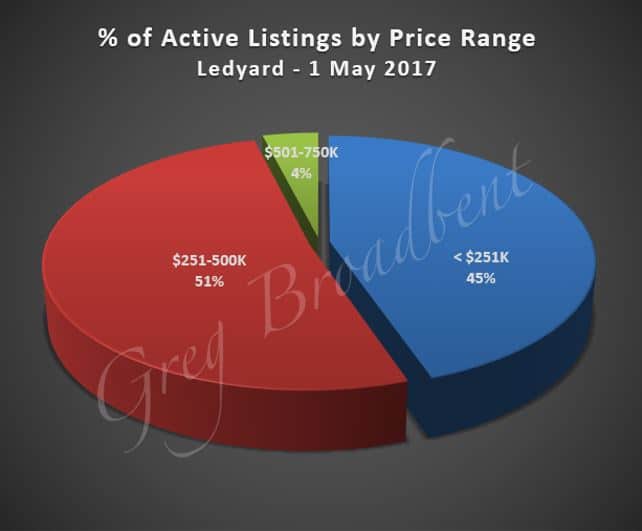
The average price for homes actively listed on May 1st was about $287,000. Listing prices ran from $39,000 to almost $690,000 with $271,000 as the median. The chart below provides more information about the distribution of the list prices.
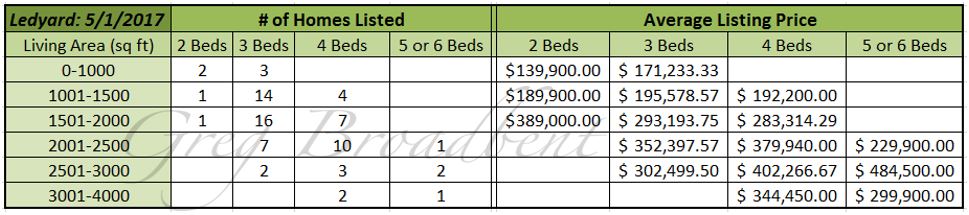
The following chart provides more detail relating asking price to attributes of homes. It shows the count and the average listing price for homes broken down by a range of living area and number of bedrooms (for homes with 2-6 bedrooms).
Recent Activity
For the 29 homes under deposit on May 1st, the approximate average listing price was around $257,500. Although the prices ranged widely from $85,000 to almost $460,000, the $250,000 median was close to the average listing price. Averages for these homes included close to 1900 square feet of living space, 3.6 bedrooms, and 1.9 full bathrooms. In addition, 19 (~66%) of them offered a single half-bathroom. The corresponding listings for these homes had been active for an average of 41 days.
Buyers and sellers completed closing transactions for 16 homes in Ledyard in the last month, in April. The average closing price was a little under $220,000. The average living area in these homes was about 1800 square feet. In addition, they offered an average of 3.6 bedrooms and 1.8 full bathrooms. 9 (~56%) of these 16 offered a single half-bathroom as well. Finally, the listings for these homes had been active on the market for an average of 87 days.
Past Closings
Looking back a little farther, there were closings for 50 homes in Ledyard in the 1st quarter of 2017. Closing prices for these homes were in a broad range from $24,500 to $420,000. The average closing price was almost $225,000 and $222,000 was the median. For living area, these homes offered an average of approximately 1880 square feet. Also, these homes included between 1 and 6 bedrooms and the average was 3.4 bedrooms. There were between 1 and 4 full bathrooms with the average at 2.0 full bathrooms. In addition, 24 (~48%) of these homes offered either one or two half-bathrooms as well. Their listings were active for an average of 75 days – about 2½ months. The median period for these listings being active was a bit lower at 53 days – a little under 2 months.
For comparison, there were only 38 closings for the same 1st quarter period a year earlier in 2016. Closing prices in this period ran from $76,000 to almost $400,000. The average and median closing prices were a little lower at about $216,000 and almost $205,000 respectively. Also, the average living area offered was about 1890 square feet. In addition, these homes included on average 3.5 bedrooms and 1.7 full bathrooms. 22 (~58%) of them included a single half-bathroom as well. Finally, the corresponding listings remained active for an average of about 87 days, with a 65 day median.
Longer-Term Retrospective
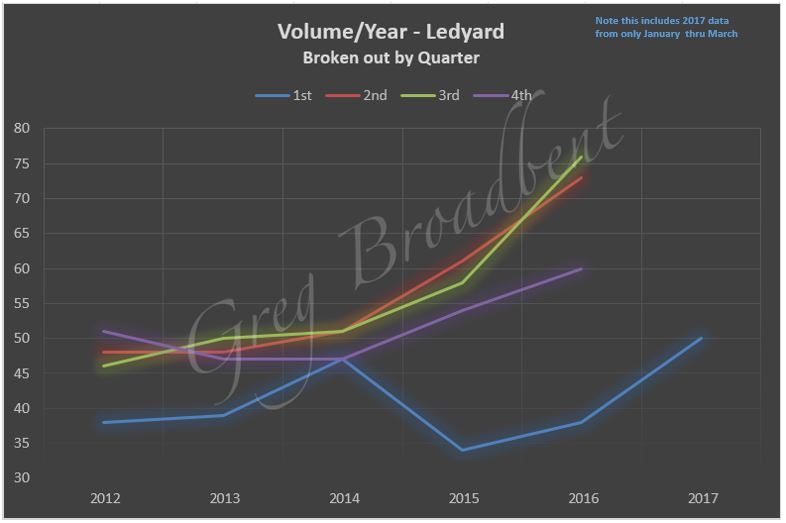
As far as longer term trends go, the chart below shows that the number of homes sold generally improved year over year in each quarter since 2013 with the exception being the 1st quarter taking a dip in 2015.
The next chart below shows that the number of homes sold per quarter for the 20 quarters comprising the period from 2Q2012 through 1Q2017. This shows that the sales volume for homes with 2, 3, 4, and 5-6 bedrooms is primarily driven by 3 and 4 bedroom homes. Many fewer homes are sold with 2 and 5-6 bedrooms.
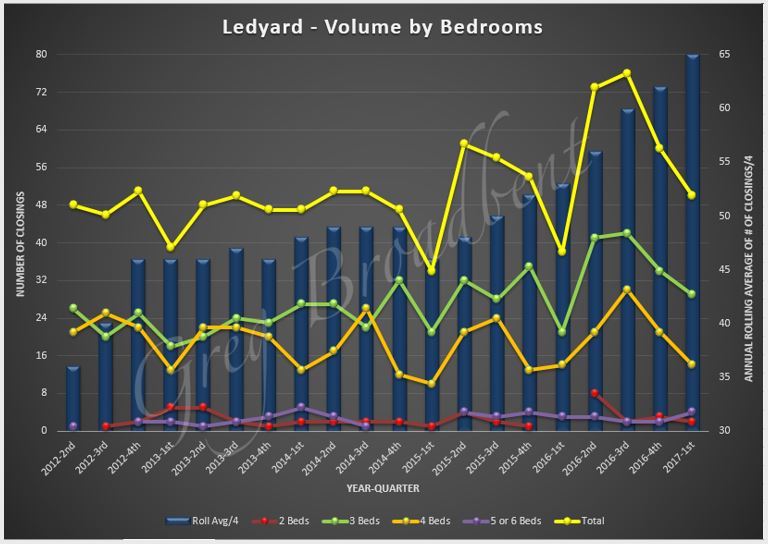
Next, the chart below shows a 12-month quarterly “rolling average” for closing prices broken down by the same bedroom count criterion as well as an overall average for the same time period. It suggests that closing prices have been more or less holding steady overall and for homes with 3 and 4 bedrooms. There seems to have been more fluctuation in the prices for the 2 and 5-6 bedroom homes. The greater fluctuation for 2 and 5-6 bedroom homes is to be expected, given that many fewer homes are included in the calculations, as indicated in one of the charts above.
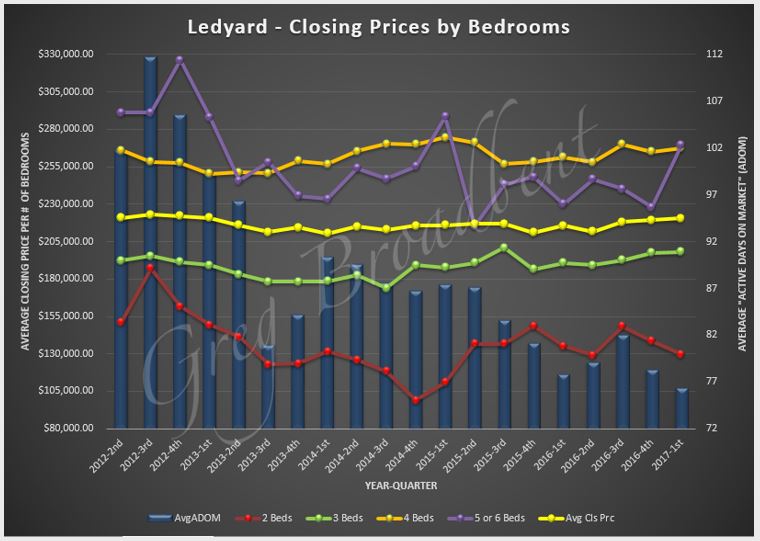
In addition, the background bars in blue in this chart show 12-month quarterly “rolling average” for the number of days listings stayed active on the market for the same 5-year period. This suggests that the amount of time a listing remains active remains as low as it has over the past period – homes seem to be selling more quickly on the average.
The final chart below shows a 12-month quarterly “rolling average” for closing prices for homes broken down by range of living area as well as an overall average for the same time period. This also suggests that the average closing prices have more or less held steady over the period with the price fluctuation being in the larger homes of which fewer are sold, as mentioned above.
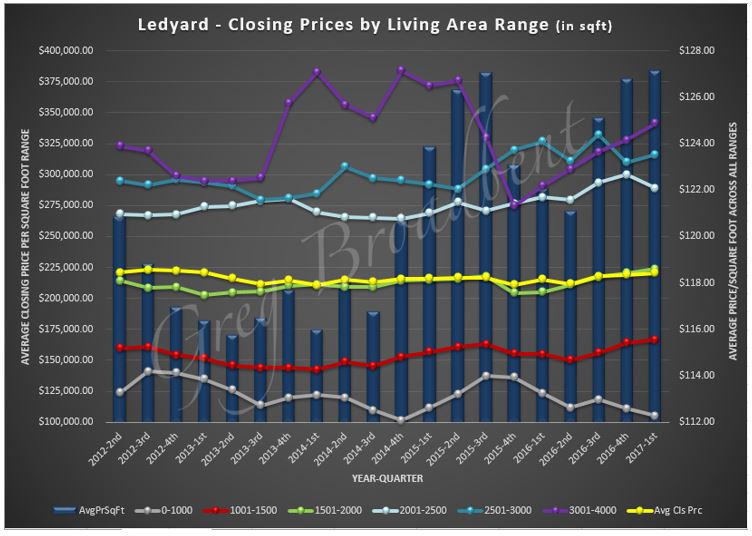
The background bars in blue in this chart show 12-month quarterly “rolling average” for the overall closing price PER SQUARE FOOT over the same 5-year period. This metric might suggest that from a buyer’s perspective, they are getting more living area overall for their money than 5 years ago.
Conclusion
We’ll be monitoring the market over the coming months to see if there are other trends or data of interest which we can share with you and will post these to our Ledyard Real Estate Page.
The data reported above was based on data obtained from the CTMLS as of 5/1/2017. If you are looking for a home in the Ledyard area or if you would like to work with a local Realtor, please feel free to call us. We look forward to helping you find just the right home for you.

