
In summary, 33 homes were listed for sale in North Stonington by local Realtors as of January 3rd. This is 9 fewer than the 42 that had been actively listed on December 1st. Of these 33 properties, 29 were also actively listed as of December 1st, and 19 had also been actively listed 3 months ago on October 1st. There were 5 homes under deposit on January 3rd. There were 7 closings and 2 new listings added to the CTMLS listings in December for North Stonington.
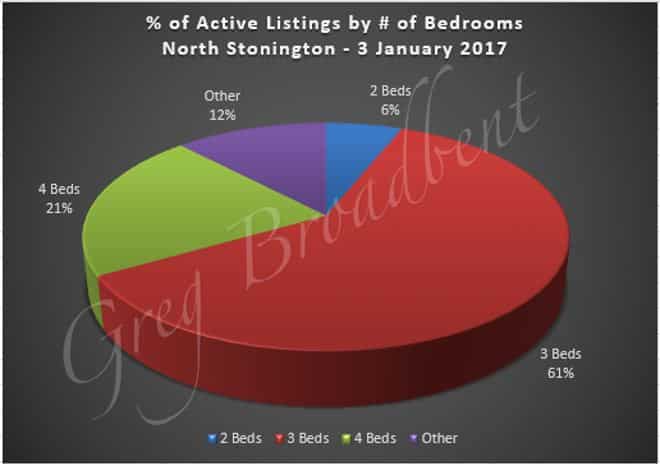
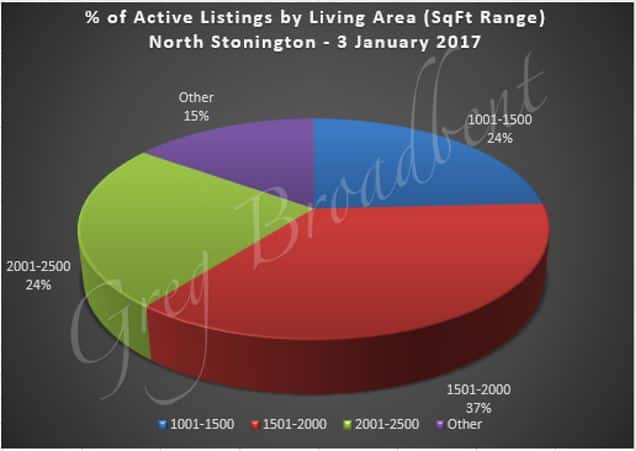
The average size for the 33 homes actively listed on January 3rd is a little over 1875 square feet with the range going from 620 to almost 3850 square feet. The number of bedrooms ranges from 1 to 8 and the average is 3.4 bedrooms. The number of full bathrooms also ranges from 1 to 8 but the average is 2.2 full bathrooms; 12 (~36%) of these homes had at least one half-bathroom. The following charts give a little more data about the size-related attributes of these homes.
|
|
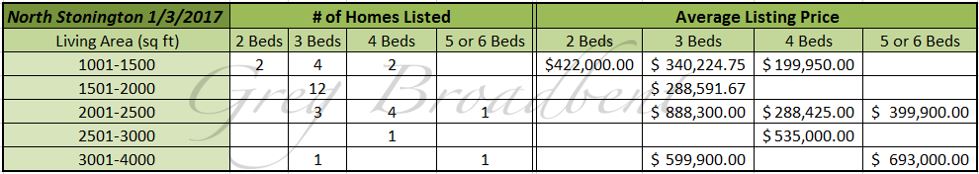
The average listing price for these 33 homes is a little under $385,000 but well above the median of approximately $291,000. Prices range from a little under $83,000 to $1,400,000. The chart below gives more detail about factors related to the listing price in breaking down the number of homes by living area (square feet) and number of bedrooms (for homes with 2-6 bedrooms), and the average listing price for each combination of living area/number of bedrooms for homes with active listings as of January 3rd.
As of January 3rd, there were also 5 homes under deposit. The average size for the homes under deposit is a bit under 1650 square feet. These homes had an average of 2.8 bedrooms and 1.8 full bathrooms. The average listing price for the homes under deposit was about $190,000 with the prices ranging from about $120,000 to $285,000.
There were closings for 7 homes in December. This brought the number of homes sold in North Stonington for the 4th quarter to 22, and for 2016 to 79. This was 2 more houses that sold in 2016 than the 77 that sold in 2015.
The average size for the 7 homes which closed in December was about 2025 square feet. They had an average of 3.3 bedrooms and 2 full bathrooms. These listings were active on the market for an average of 135 days, but the median value here was much lower at 55 days. The average closing price for these 7 homes was a bit more than $270,000. Prices were in the range from $148,000 to $396,000.
The average size for the 22 homes which closed in the 4th quarter of 2016 was about 1900 square feet. The median was slightly lower at 1833 with the range extending from about 770 square feet to almost 3400 square feet. They had an average of 3.5 bedrooms and 1.9 full bathrooms; 8 (~36%) of these had one half-bathroom as well. These listings were active on the market for an average of 130 days. The median value here was much lower at 53 days with the range running from 4 to 789 days. The average closing price for these 22 homes was almost $253,000 with a median just a little lower at $246,500. Prices ranged from $55,000 to almost $420,000.
For comparison, the average size of the 17 homes which closed in the 4th quarter of 2015 was about 1830 square feet. They had a slightly higher median at 1894 square feet. The range of areas ran from a little under 600 to 3500 square feet. They had an average of 3.2 bedrooms and 1.8 full bathrooms, and 8 (~47%) of these had one half-bathroom. These listings were active on the market for an average of 65 days. The median value here was 50 days and the range was much more narrow at 3 to 169 days. These 17 homes had an average closing price at a little under $250,000. This median value was also higher at $267,500 with prices in the range from $51,000 to $420,000.
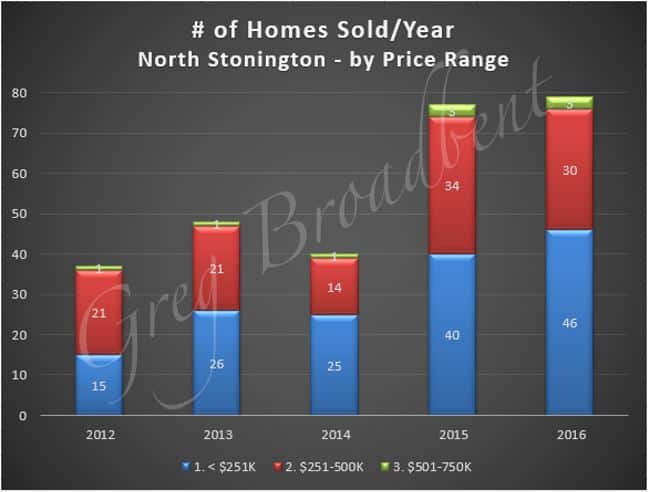
Some longer term perspectives are presented in the charts below. The first chart shows the number of homes sold over the past 5 years broken down by range of closing prices. It suggests that volume over the last two years was markedly higher than that in the previous three years.
Next, the chart below shows a 12-month quarterly “rolling average” of closing prices for homes with 2, 3, 4, and 5-6 bedrooms as well as an overall average for the years 2012 through 2016. It suggests that closing prices more or less continued to hold steady overall.
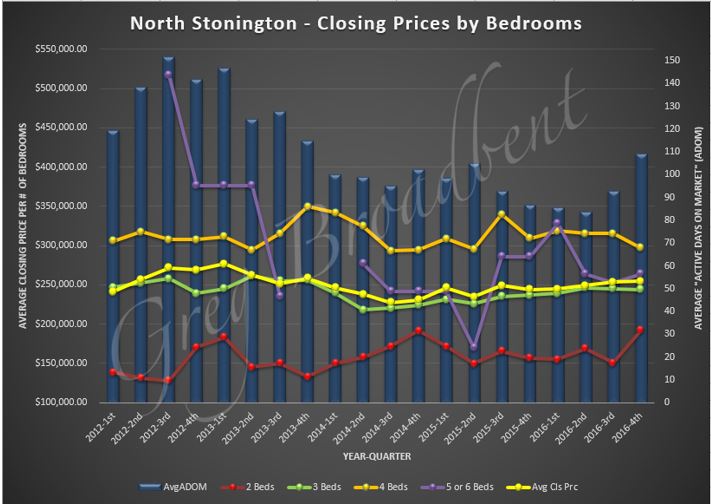
The background bars in blue in the chart above also provide a 12-month quarterly “rolling average” for the number of days listings stayed active on the market for the same period. This suggests that the amount of time a home remains listed before being sold decreased significantly after 2012 but then increased over the past 2 quarters.
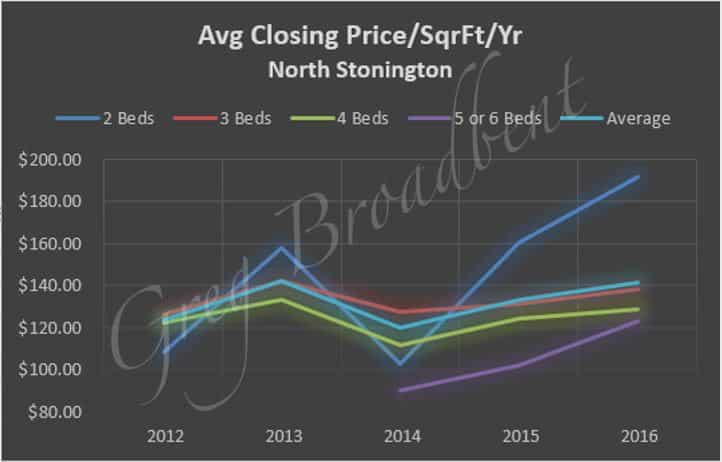
Finally, the chart below gives another perspective on closing prices over the past several years. It suggests that generally the closing price per square foot has been increasing slightly over the past two years, but more so for 2 bedroom homes.
We’ll continue to watch the residential property market and bring you additional observations and data in future blogs. The data reported above was based on data obtained from the CTMLS as of January 3rd 2017. Updated information is available on our North Stonington Real Estate Page.
If you are looking for a house in North Stonington or if you would like to work with a Realtor in the North Stonington area, please feel free to call us. We look forward to helping you find just the right home for you.

