
20 residential properties were listed by local Realtors in Noank on August 1st. There were also 20 homes actively listed for sale in Noank on July 1st. 18 of the homes listed on August 1st were also listed on July 1st.
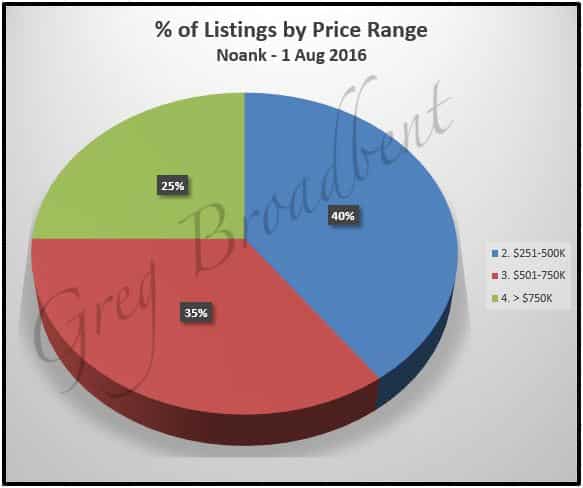
The average listing price for the 20 homes listed as of August 1st was a little under $570,000; prices were in the range of $275,000 to $995,000 with $549,000 as the median price. The chart below gives a percentage breakdown of homes in different price ranges listed for sale in Noank.
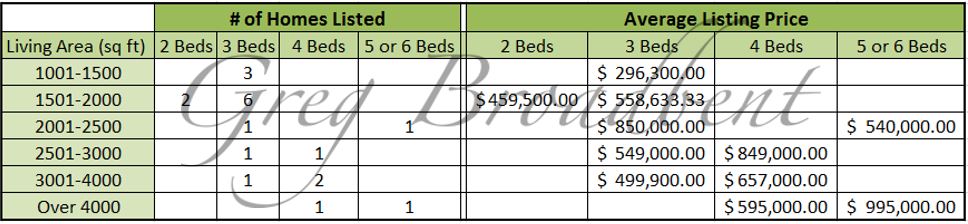
The average size of these homes was just over 2400 square feet with 3.3 bedrooms and a little over 2 full bathrooms; 11 of these 20 homes have at least one half-bathroom.
The chart below provide some additional detail about the how the number of bedrooms and range of living area sizes affects the list price.
There were no homes under deposit as of August 1st, down from the 2 residential properties which were listed as under deposit as of July 1st.
There were no closing transactions for homes in Noank in July, but there had been 4 closings in June. The 4 homes which closed in June had an average closing price just under $299,000. The average size for these 4 homes was around 2050 square feet with 3 bedrooms and 1.5 full bathrooms. These homes had been on “Active on the Market” for an average of 149 days.
A year ago in July of 2015, there were also closings for 4 homes. These homes had an average closing price of just over $355,000 with the average size of about 1925 square foot home with 3.25 bedrooms and 1.50 full bathrooms. These homes had an “Active Days on the Market” (ADOM) average of 86 days.
The chart below gives more information on homes sold in Noank since the beginning of 2011 through to August 1st.
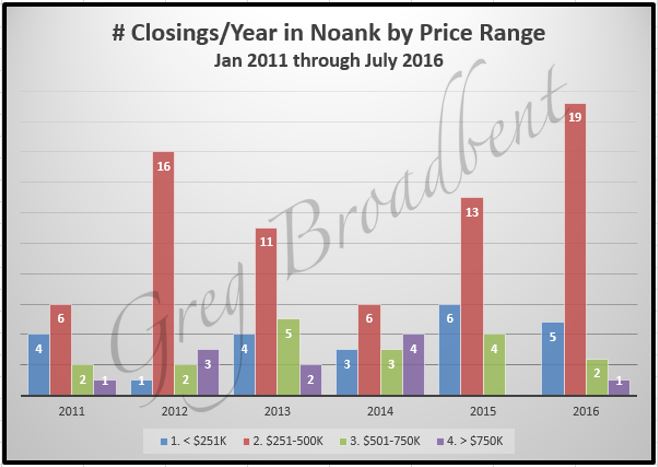
Remembering that the 2016 data represents only 6 months of activity, the chart suggests that activity during this time period bottomed out in 2014 with improvement shown in 2015 which seems to be continuing into 2016.
Finally, the chart below provides some information on trends in closing prices. It shows a 4-quarter “rolling average” of closing prices for homes sold per quarter over the past 5 years in total and also broken down by number of bedrooms (for homes having 2-6 bedrooms).
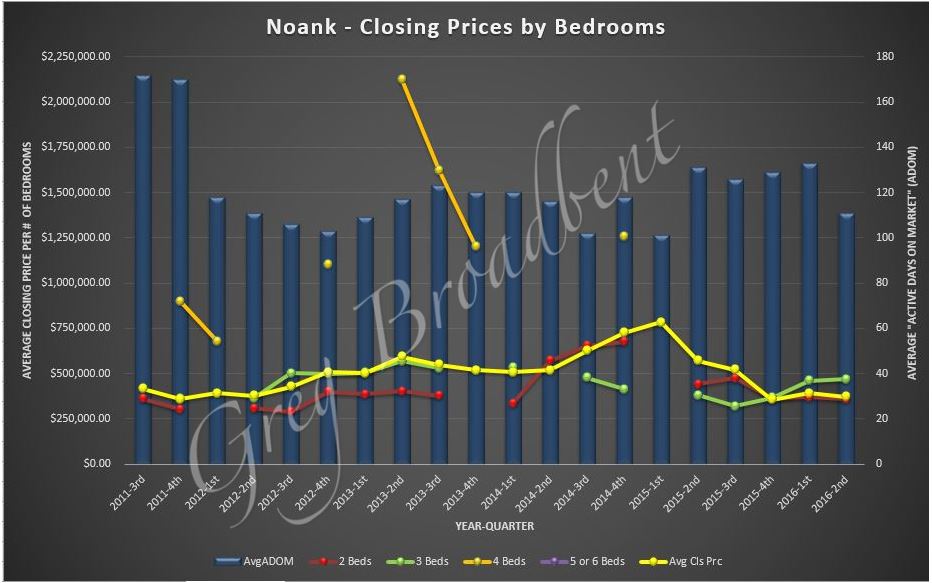
The chart above also shows a 4-quarter rolling average for “Active Days on Market” for homes with any number of bedrooms. Although the drop in the 2nd quarter 2016 ADOM might portend homes could be poised to sell more quickly in the near term than in recent quarters, the longer term trend is not as encouraging.
We’ll continue to watch market activity in Southeastern Connecticut over the coming months to share data of interest with you in future blogs.
This residential property data was taken from the CTMLS as of Augsut 1st 2016. Updated information will be posted on our Noank Real Estate Page. If you are looking to buy or sell a home in Noank or to work with a local CT Realtor, please feel free to call us. We look forward to helping you find just the right home for you.

