
There were 16 homes listed for sale by local Realtors in Noank as of October 3rd which is 4 fewer than the 20 that were actively listed on September 1st. 14 of these 16 homes were also actively listed on September 1st, and 6 of them were actively listed 3 months ago on July 1st as well. 2 new listings were added in September.
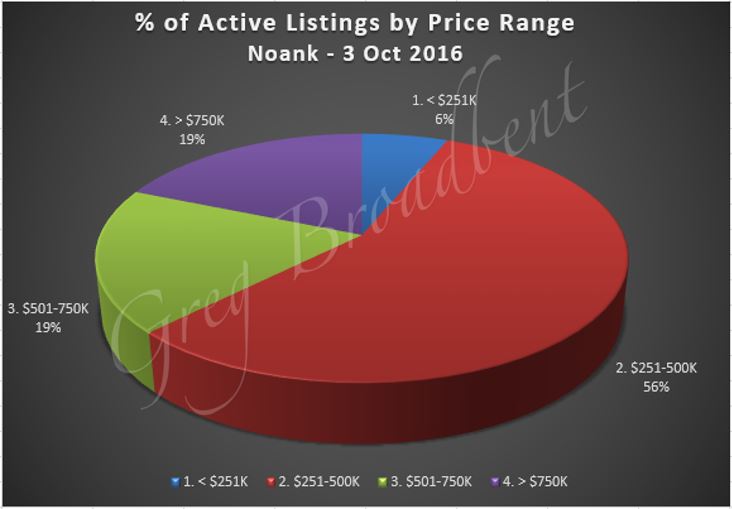
The average listing price for the 16 homes listed as of October 3rd was a little under $470,000. Prices were in the range of $224,900 to almost $950,000 with $379,500 as the median price. The chart below gives a percentage breakdown of homes in different price ranges listed for sale in Noank.
The average size of these homes was a little under 1950 square feet with sizes ranging from slightly over 1130 to slightly under 3775 square feet. 1844 was the median square footage for these 16 homes. There was an average of 3.2 bedrooms and 1.8 full bathrooms; 7 (~44%) of these 16 homes have at least one half-bathroom.
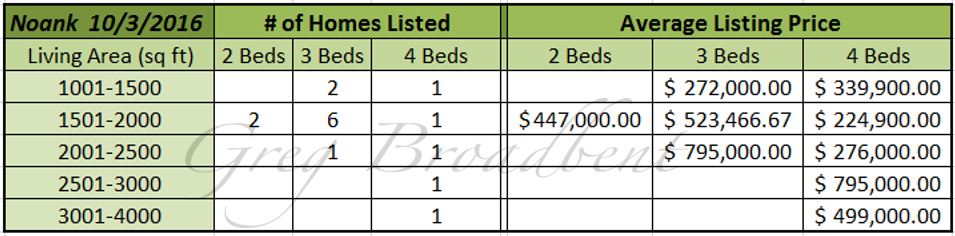
The chart below provide some additional detail about the how the number of bedrooms and range of living area sizes are related to the list price.
There were no homes under deposit as of October 3rd, down from the 5 residential properties which were listed as under deposit on September 1st.
There was one closing on a home in Noank in September which was the only one for the 3rd quarter. It brought the total number of closing transactions for Noank in 2016 to 13.
The average closing price for the 13 homes sold through the end of the 3rd quarter in 2016 was a little under $410,000. Prices were in the range of $155,000 to $1,210,000 with the median price at $350,000. Closing price per square foot had an average of $195.50 with $160.50 as the median value. These homes were listed for an average of 98 days, but the median listing duration was 78 days.
The average size of these 13 homes was a little over 2200 square feet. The median home size was 2223 square feet and sizes ranged from slightly under 870 to over 4050 square feet. There was an average of 3.2 bedrooms and 2 full bathrooms; 7 (~54%) of these 13 homes have at least one half-bathroom.
The chart below gives more information on homes sold in Noank since the beginning of 2011 through to September 30th of this year.
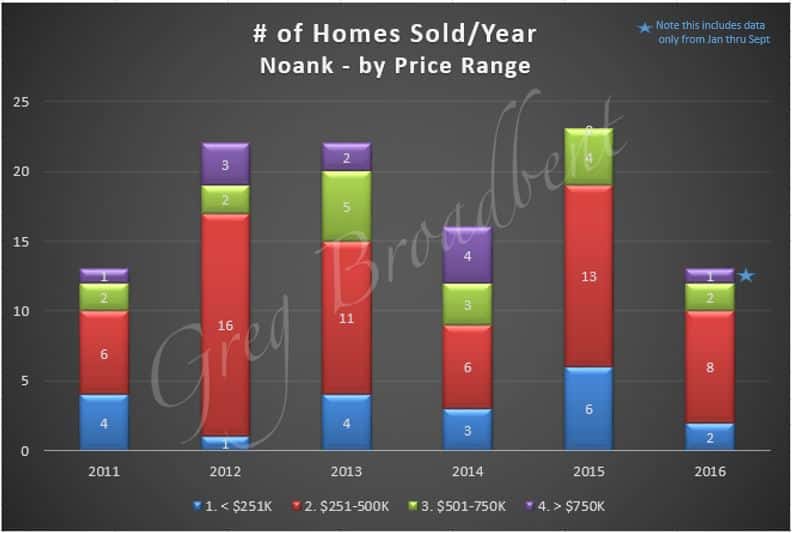
Remembering that the 2016 data represent only 9 months of activity, the chart suggests that the number of completed sales will be lower this year than last, but will probably be better than in 2014.
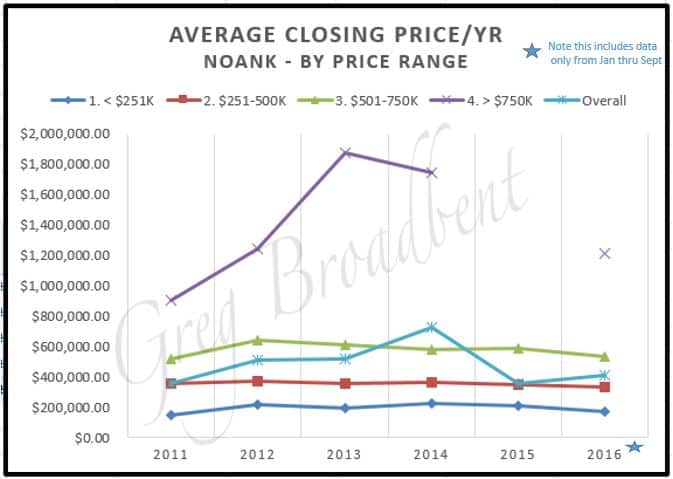
Finally, the chart below provides some information on trends in closing prices. It suggests that prices for homes that sold for less than $750,000 have more or less held steady relative to 2011.
We’ll continue to watch market activity in Southeastern Connecticut over the coming months and share trends or other data of interest with you in future blogs.
This residential property data was taken from the CTMLS as of October 3rd 2016. Updated information will be posted on our Noank Real Estate Page. If you are looking to buy or sell a home in Noank or to work with a local CT Realtor, please feel free to call us. We look forward to helping you find just the right home for you.

