
Summary
In summary, there were 77 homes listed for sale by local Realtors in Mystic as of April 3rd. Note that this includes properties on both the Groton and Stonington sides of the Mystic River. This 77 count was 12 more than the 65 listed on March 1st. Of the 77 active listings, 47 were also active a month ago on March 1st, and 30 were active 3 months ago on January 3rd. In addition, the CTMLS listed 21 homes as under deposit as of April 3rd. Local Realtors added 25 new listings to the CTMLS last month. Finally, sales closed for 8 homes in Mystic in March.
Recent Activity
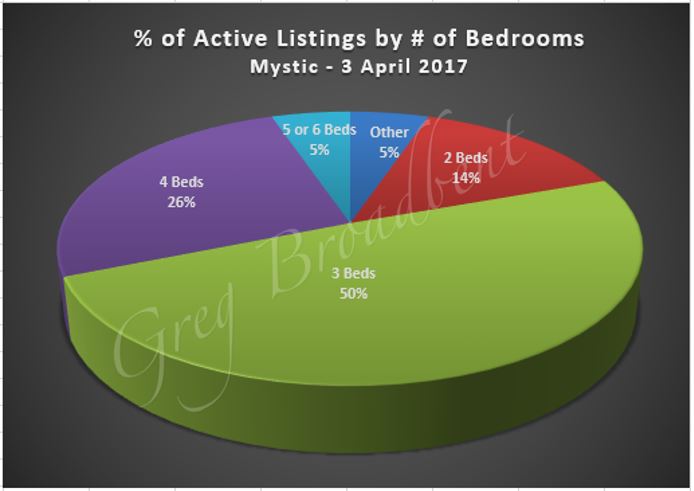
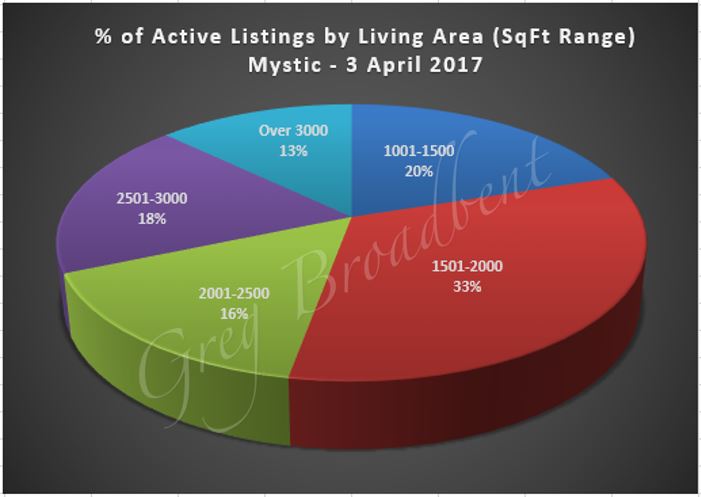
The size of the average house listed for sale in Mystic was around 2125 square feet with 3.3 bedrooms and 2¼ full bathrooms. 25 (~ 32%) of these 77 homes included from 1 to 5 half-bathrooms as well. The following charts give some additional detail on the breakdown of available homes by number of bedrooms and ranges of living area in Mystic.
|
|
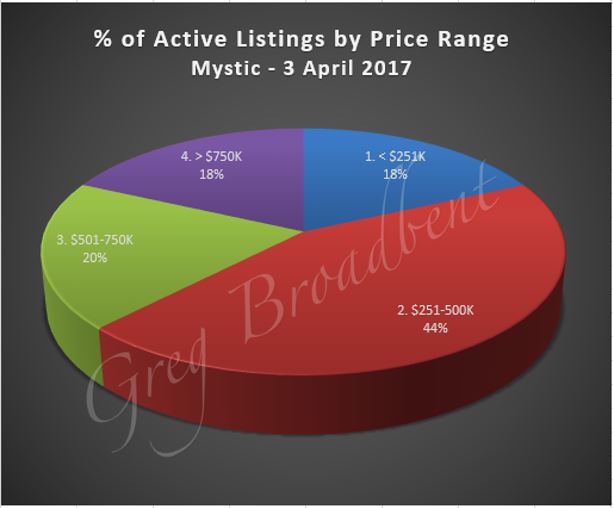
Across Mystic, the average listing price was a little under $600,000 with a much lower median at approximately $416,000. Prices ranged from almost $140,000 to $3.2M. The chart below gives a percentage breakdown of homes listed in different price ranges in Mystic.
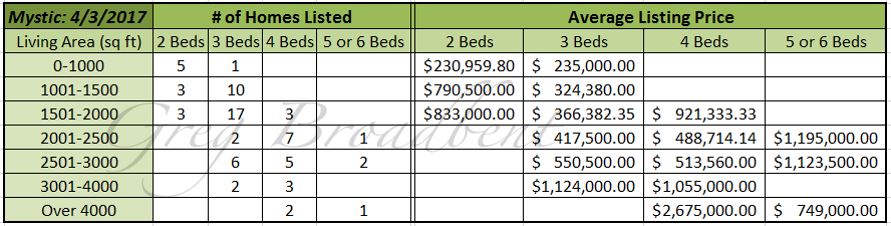
The following chart provides more detail relating asking price to attributes of homes. It is broken down by a range of living area and number of bedrooms (for homes with 2-6 bedrooms). It shows the count and the average listing price for homes with each combination of attributes.
There were 21 homes under deposit at this time as well. The average price for these homes was a little over $320,000. However, the range for the listing prices was relatively narrow, running from $155,000 to $630,00. In addition, the average home from this set featured about 1800 square feet of living area, 3.4 bedrooms, and 2.0 full bathrooms. 10 (~48%) offered a single half-bathroom as well. Corresponding listings for these homes were active for an average of 61 days. The median value was a much shorter 30 days.
Sales closed on 30 homes in Mystic in the 1st quarter. The average closing price for these homes was a bit over $300,000. However, the median price was only about $250,000 for prices in a broad range from just over $100,000 to almost $1.2M. The average home included 3.3 bedrooms and 1.6 was the average number of full bathrooms. In addition, 13 (~43%) offered a single half-bathroom. Finally, the corresponding listings for these homes were active on the market for about 83 days on the average. The median value for this metric was 59 days.
Past Activity
The following chart shows the number of homes sold in Mystic broken down by price range. It covers the past 5 full years and includes data for 1Q2017.
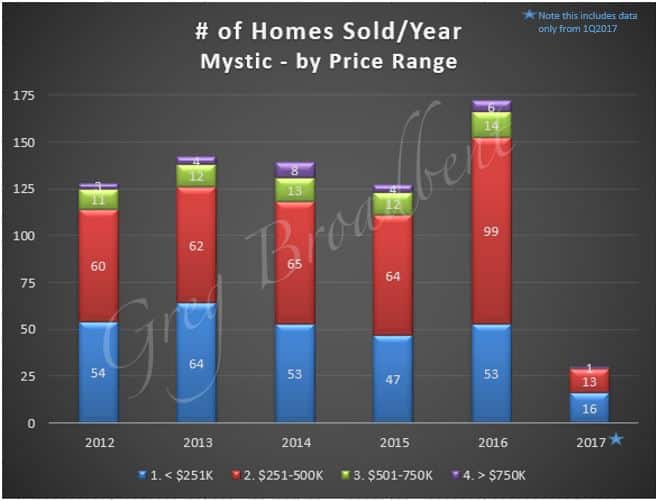
In comparison to what’s happened so far in 2017, sales closed for 172 homes over all of 2016 in Mystic. The average closing price was about $376,000 and the median was almost $312,000. However, the range of closing prices was very broad extending from $60,000 to $4M. The average home for this set featured close to 2000 square feet of living area. In addition, it offered an average of 3.4 bedrooms and 2.0 full bathrooms. Also, 89 (52%) of these homes included one or two half-bathrooms as well. These homes were active on the market for an average of 104 days. Again, the median value was much lower at 58 days.
Looking at the longer term, the following chart shows the number of homes sold in Mystic per quarter for the 5-year period ending with 1Q2017. It breaks down the count by number of bedrooms (for homes with 2-6 bedrooms) as well as showing the total number of homes sold in the quarter.
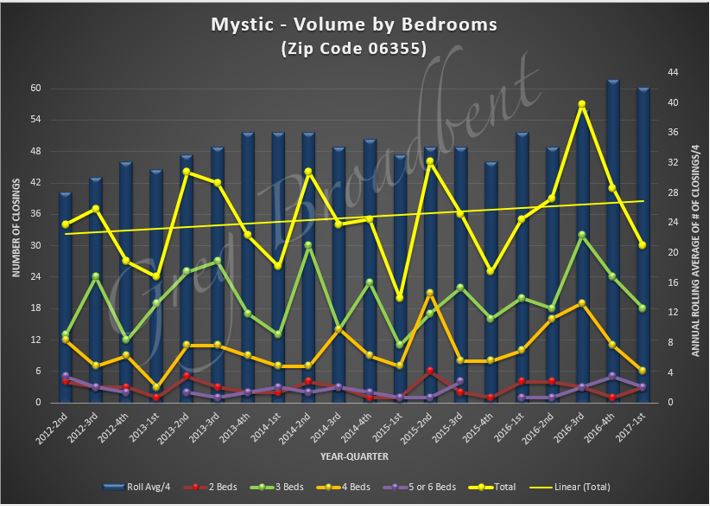
The “linear” trend line in the chart above for the total count, added using MS-Excel, shows a slightly positive slope. Both this trend line and the quarterly “rolling average” reflected in the blue bars in the background suggest that sales volume has been increasing slowly but steadily over the period.
The chart below shows a 12-month quarterly “rolling average” of closing prices broken down by number of bedrooms. It shows averages for homes with 2-6 bedrooms as well as an overall average, and covers the 5-year period ending with 1Q2017. Even though the fluctuation is pretty consistent, the slope of the MS-Excel “linear” trend line added for the overall total average suggests that prices also slowly but steadily improved over the period.
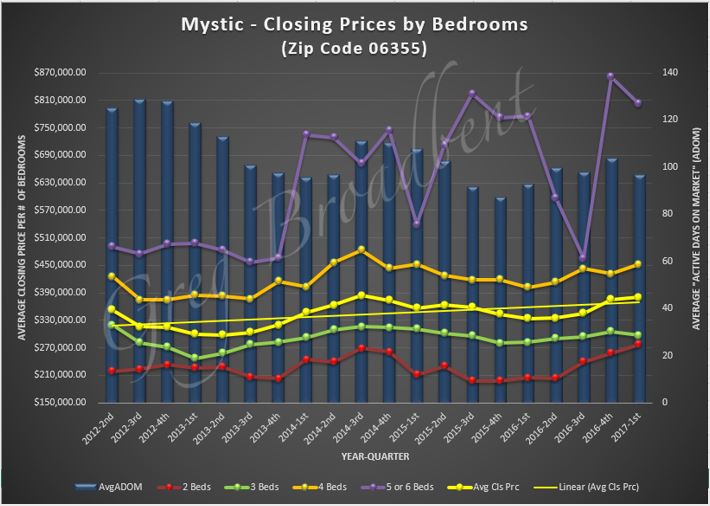
Finally, the blue bars in the chart above also show a 12-month quarterly “rolling average” for number of days listings stayed active on the market for the same period. This suggests that the amount of time a home remains listed before being sold is steadily decreasing despite the fluctuations.
Conclusion
We’ll be monitoring the market over the coming months to see if there are other trends or data of interest which we can share with you in future blogs.
The metrics reported above were based on data obtained from the CTMLS as of April 3rd 2017. Updated information is available on our Mystic Real Estate Page.
If you are looking for homes for sale in Mystic or if you would like to work with a CT Realtor in the area, please contact us today. We look forward to helping you find just the right home for you.

