
Local real estate agents had 12 homes listed for sale in the Stonington Borough on November 1st. This was 4 fewer than the 16 listings that were active on October 3rd. All 12 of these listings were also active on October 3rd, and 10 of them were active 3 months ago on August 1st as well. There was 1 home under deposit as of November 1st in the Borough, and no new listings were added in October.
The listing prices for these 12 homes were in a broad range between $475,000 and $6,750,000. The average listing price was almost $1,960,000 and the median was just below $1,550,000. The chart below provides some additional detail.
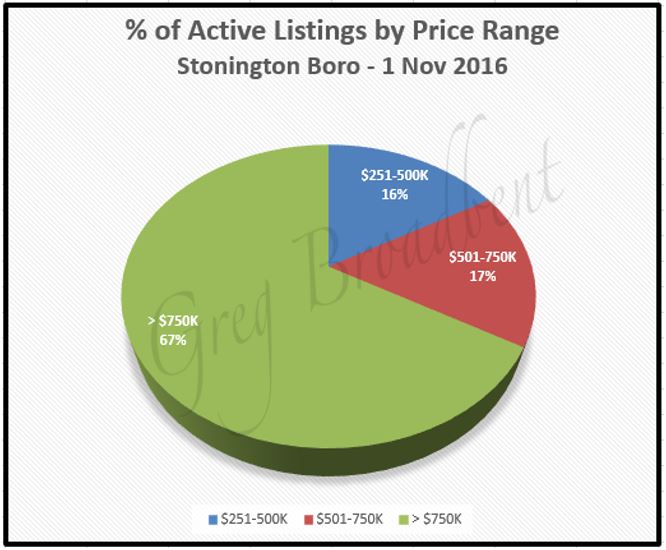
The living areas varied widely as well and were between 1300 and 7550 square feet with the average at 3760 and the median at 3860 square feet. These homes had between 2 and 8 bedrooms with an average of 4.4 bedrooms. Also they had between 2 and 8 full bathrooms with an average of 4 and 8 of the 12 had at least 1 half-bathroom.
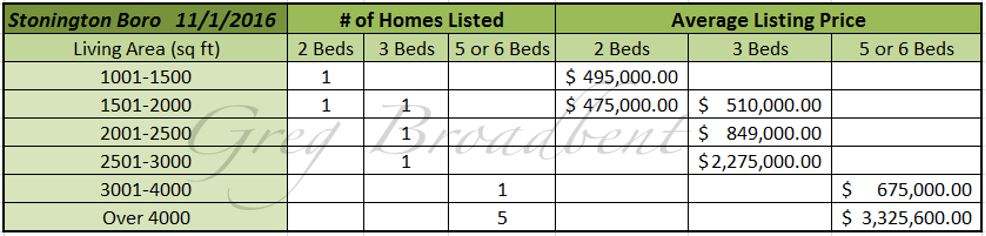
To complete the review of active listings, the chart below provides some additional detail about the number of homes listed by number of bedrooms (for homes with 2-6 bedrooms) and range of living area size, as well as the corresponding listing price or average of listing prices.
There were 5 closings so far in 2016 for homes in the Stonington Borough: 1 each in January, April, May, July, and October. The closing prices ranged between $420,000 and $1,800,000 with the average at $866,000. These homes had either 3 or 4 bedrooms, and between 2 and 4 full bathrooms; 3 of the 5 had at least one half-bathroom. The listings for these homes were active on the market for between 71 and 875 days with the average at 274 days.
For comparison, there were closings for 7 homes in the Stonington Borough for all of 2015. The closing prices ranged a bit more broadly than those in 2016 from $250,000 to $2,200,000 with the average closing price being about $815,000. These homes had between 2 and 5 bedrooms with the average being 3.3 bedrooms. They also had between 2 and 5 full bathrooms with 2.9 as the average and 5 of them had at least one half-bathroom. Their respective listings were active on the market between 34 and 766 days with 230 being the average.
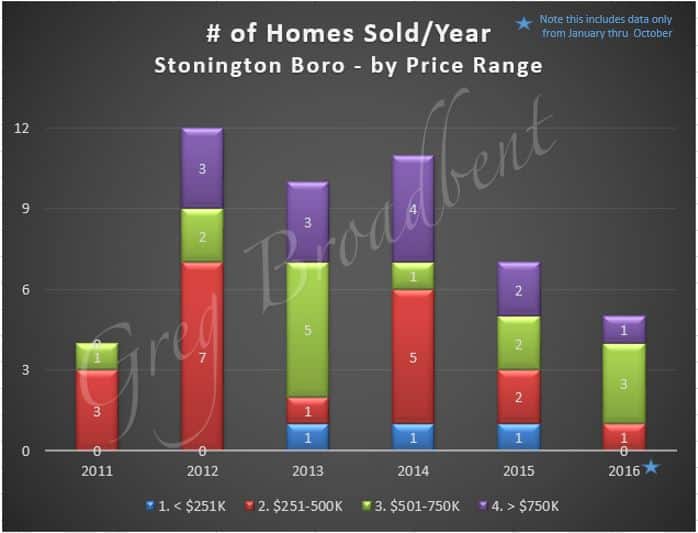
Looking over the longer term, the chart below shows the number of homes sold each year since 2011 broken down by closing price range.
Finally, the chart below shows a 12-month quarterly “rolling average” and a 12-month quarterly “rolling median” for closing prices in the 5 years between the 4th quarter of 2011 and the 3rd quarter of 2016, as well as the specific quarterly averages which fluctuate greatly. These lines suggest that the closing price averages are holding steady overall, while the median closing prices might be increasing slightly.
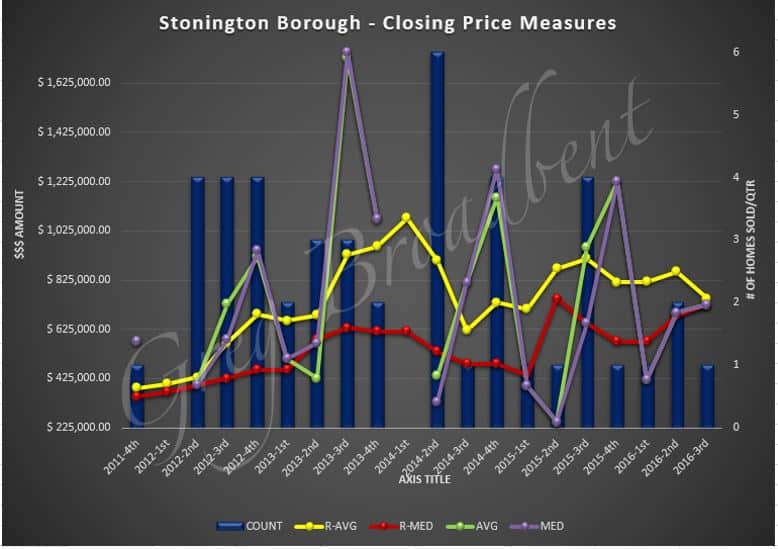
For some additional context, the bars in the background in the chart above show the number of homes for which there were closing transactions in the Stonington Borough per quarter also.
We’ll be monitoring the market over the coming months to see if there are other trends or data of interest which we can share with you in future blogs.
The trends reported above were based on data obtained from the CTMLS as of November 1st 2016 for single family residential properties. Updated information will be posted on our Stonington Borough Real Estate Page. If you are considering purchasing a home in Stonington or if you would like to work with a Realtor in the area, please feel free to call us. We would love to help you buy or sell your next home.

