
Local real estate agents had 16 homes listed for sale in the Stonington Borough on August 1st including 3 new listings added in July and 13 listings which were also active on July 1st. This was an increase of 3 over the 13 listings that were active on July 1st. There were no homes under deposit as of August 1st in the Borough.
The average listing price for the 16 homes listed was about $1,733,000. However, prices covered a wide range from $264,000 to $6,750,000 and had a median listing price of about $1,195,000. The chart below provides some additional detail relating the number of bedrooms and range of living area sizes to the listing price for 15 of these homes.

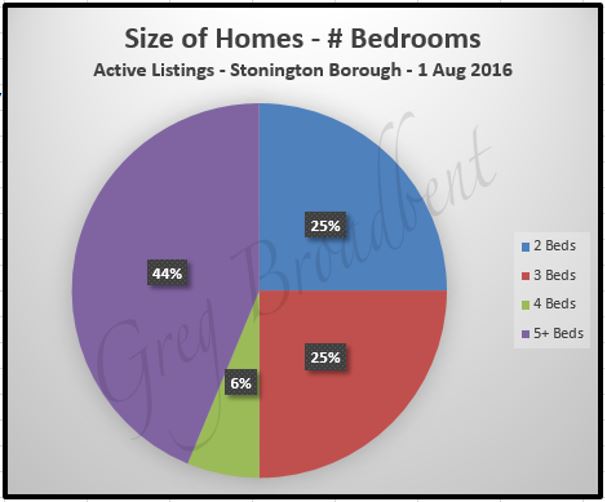
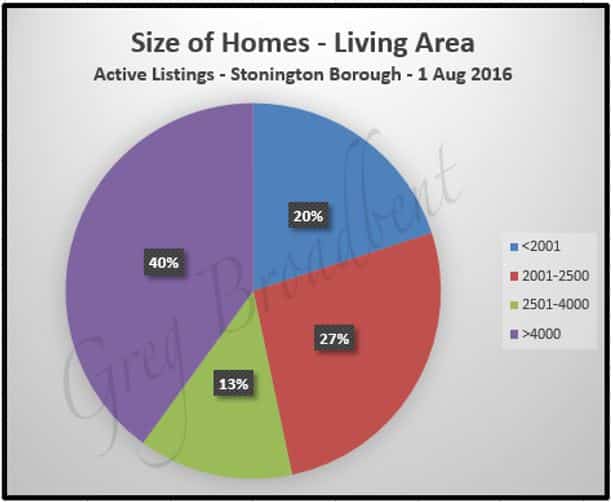
These homes had an average size of 3270 square feet with living area varying widely from 832 square feet to over 7500 square feet. Number of bedrooms varied widely also from 2 to 8 with 4 as an average number. Number of full bathrooms varied widely as well from 1 to 8 with 3.5 as the average; and 11 of these 16 homes had at least 1 half-bathroom.
The charts below provide a little more context on the size of the homes actively listed in the Stonington Borough as of August 1st.
|
|
There were 4 homes in the Stonington Borough for which sales closed in 2016 so far, with the most recent being last month in July. The average closing price was $632,500 in a relatively narrow range from $420,00 to $750,000 for 3 to 4 bedrooms and 2½ to 4 bathrooms. These homes had an average living area of about 2260 square feet with the range being 2168 to 2454 square feet. These homes had been listed for an average of 325 days, although there was a broad range in “Active on the Market” – from 76 days to 875 days.
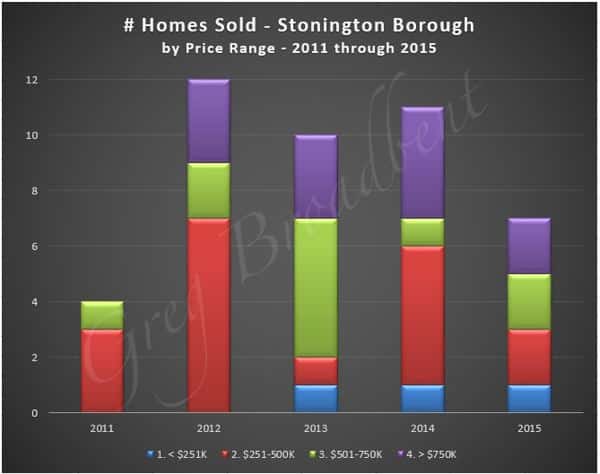
Looking at longer term trends, there were 44 homes in the Stonington Borough which had closing transactions in the five years 2011 through 2016. The chart below breaks down the number of homes sold each year broken down by the range of closing.
The chart below provides some information on trends in closing prices. It shows a “rolling average” for closing prices of homes sold per quarter in total over the past 5 years since 3rd quarter of 2011. It also shows closings prices broken down by number of bedrooms (for homes having 2-6 bedrooms).
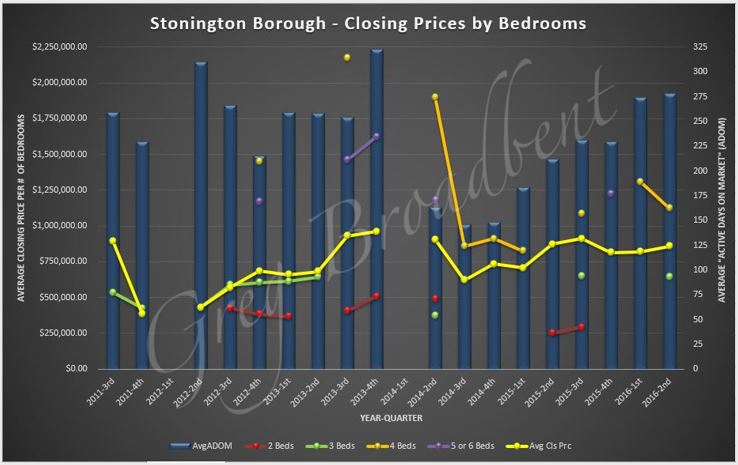
The chart above also shows a 12-month rolling average for “Active Days on Market” for all homes disregarding number of bedrooms.
We’ll continue to watch the residential property market in the local area and bring you additional observations and data in future blogs.
The trends reported above were based on data obtained from the CTMLS as of August 1st 2016 for single family residential properties. Updated information will be posted on our Real Estate Page for the Stonington Borough. If you are considering purchasing a home with in Stonington or if you would like to work with a real estate agent in the area, please feel free to call us. We look forward to helping you find just the right home for you.

