
There were 58 homes listed for sale by Realtors in North Stonington as of July 1st; 42 of these 58 homes were also listed in May, and 16 new listings were added in June.
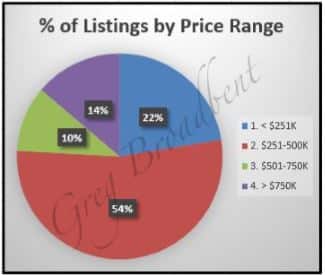
The following charts show what percentage of the homes listed as of July 1st are in each of 4 different listing price ranges.
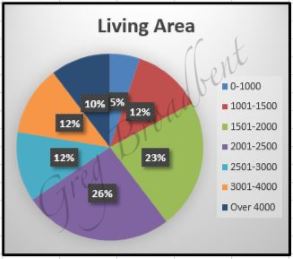
The average size for these 58 homes is a little under 2400 square feet with 3-4 bedrooms and 2-3 bathrooms; the following charts give a little more data about the attributes of these homes.
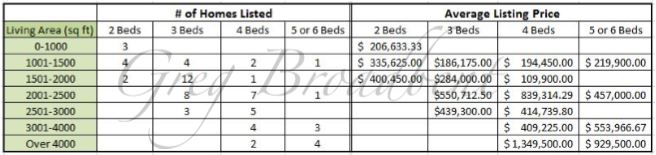
The average listing price for these 58 homes is about $510,000, well above the median of approximately $325,000; prices range from $190,000 to $3,950,000. The chart below gives more detail about factors related to the listing price in its breakdown of homes by living area (square feet) and number of bedrooms, and the average listing price for each combination of living area/number of bedrooms, for homes with active listings as of July 1st.
As of July 1st, there were also 10 homes under deposit. The average size for the homes under deposit is much smaller than for those that are listed – being about 1760 square feet with 3 bedrooms and under 2 bathrooms. The average of the contract prices is $272,400 and average “Active Days on Market” (ADOM) was about 3 months for homes under deposit.
There were closings for 12 homes in North Stonington from North Stonington real estate agents in June of 2016 as well which was a significant improvement over June of 2015 when there were closings for only 2 homes. The average size for the homes which closed in June was about 1770 square feet with 3 bedrooms and 2 bathrooms. These homes averaged being active on the market for about 3 months and the average closing price was $241,000. So, the average home under deposit as of July 1st is very much like the average home which closed in June 2016.
As far as longer term trends go, the number of homes being sold each quarter has been generally improving over the past couple of years with a slight setback in 2014.
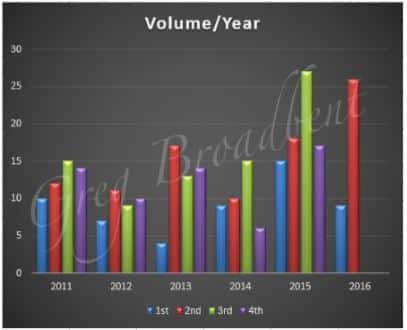
As the chart above shows a quarter-by-quarter comparison of number of homes sold over the past 5 years, 2nd quarter closings have increased strongly since 2014, and 3rd quarter closings have been increasing since 2012.
Also, over the longer term as suggested in the chart below showing a quarter-by-quarter comparison of “Active Days on Market” (ADOM) for homes which closed in the corresponding quarter, the average ADOM has been slowly going down to around 3 months – which is consistent with the ADOM averages for the homes under deposit and those which closed in June 2016.
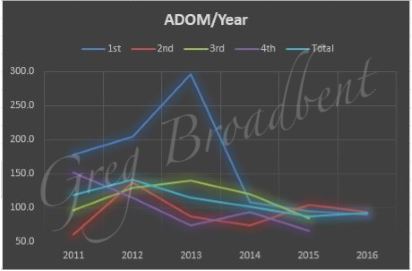
However, as the chart below shows, the average ADOM depends on other factors. This chart provides a breakdown of average ADOM by living area and number of bedrooms, and the average ADOM for each combination of living area/number of bedrooms for homes sold by real estate agents over the 2011 – 2016 period covered by the “ADOM/Year” graph above.
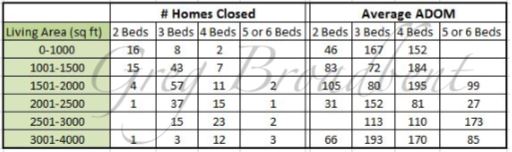
This data suggests that smaller homes tend to sell more quickly than larger homes, although this also may be affected by other factors not reflected in this breakdown.
We’ll be monitoring the market over the coming months to see if there are other trends or data of interest which we can share with you and will post.
The data reported above was based on data obtained from the CTMLS as of 7/1/2016. Updated information is available from our North Stonington Real Estate Page. If you are looking for a house in North Stonington or if you would like to work with a CT Realtor in the area, please feel free to call us. We look forward to helping you find just the right home for you.

