
In summary, there were 43 residential properties listed for sale in Pawcatuck by real estate agents as of October 3rd which is 8 fewer than the 51 that were listed on the 1st of the preceding month. Of these 43 homes, 38 were also listed on September 1st and 20 of those same listings were active 3 months previously on July 1st as well. There were 8 homes under deposit on October 3rd. Finally, closings were completed for 7 homes in September and 4 new listings were added.
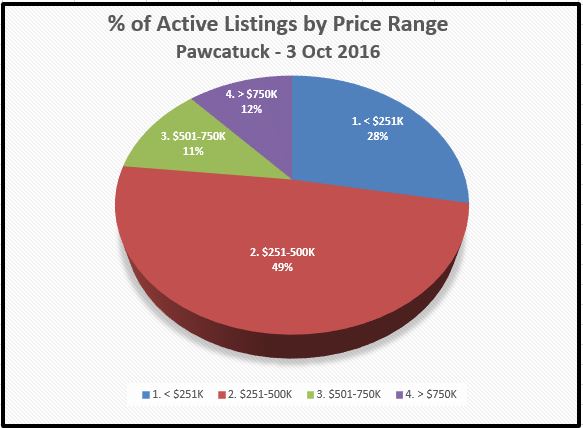
The average listing price for the 43 homes listed on October 3rd was a little over $620,000. The median listing price was $374,000 with prices in the $150,000 to $7,900,000 range. The chart below gives a percentage breakdown of homes in different price ranges listed for sale in Pawcatuck as of October 3rd.
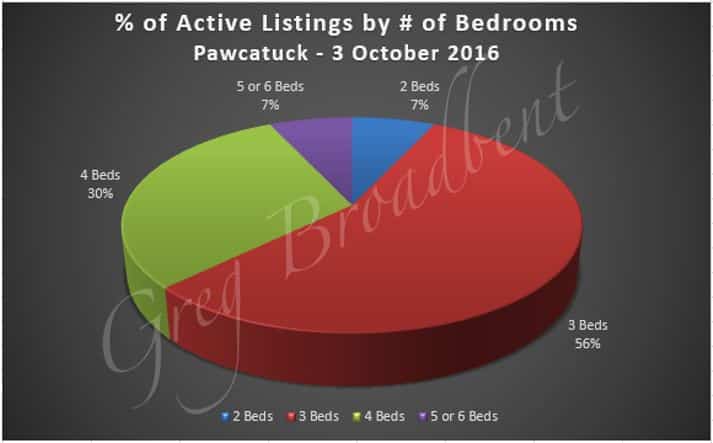
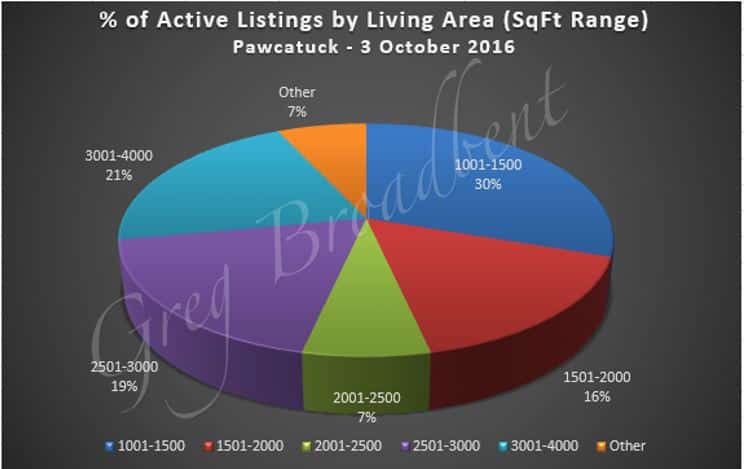
The sizes of these homes varied widely from a little over 900 to a little over 7800 square feet. The average size was just under 2250 square feet and 1970 was the median square foot value. These homes had an average of 3.4 bedrooms and a little under 2 full bathrooms; 24 (~56%) of these 43 homes have at least one half bath. The charts below provide some additional detail about the percentages of homes listed by number of bedrooms and range of living area size.
|
|
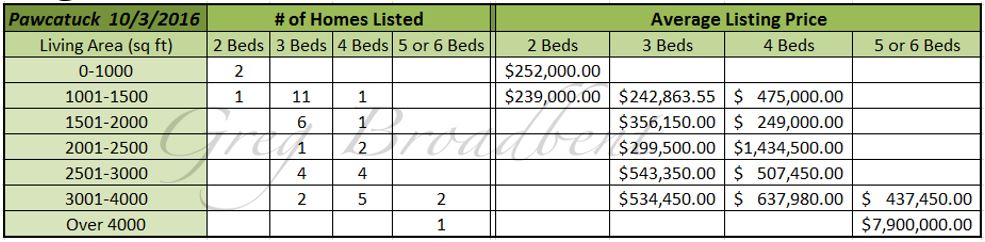
Since prices will vary based on such features as living area and number of bedrooms, the chart below provides some additional detail about the number of homes listed by number of bedrooms and range of living area size, as well as the corresponding average listing price.
There were 8 homes under deposit in Pawcatuck on October 3rd, up from the 3 which were listed as under deposit as of September 1st. The average price for these 8 homes was a little over $307,000 with the median price at a little under $277,500. Prices ranged from $185,000 to almost $520,000.
These homes had an average size of just over 2100 square feet with 1.75 full bathrooms and 3.75 bedrooms. On average, the homes under deposit as of October 3rd were active on the market for about 3 months at 86 days, but the median ADOM for these homes was only 32 days.
There were closings on 7 homes last month in September. These 7 homes had an average closing price of around $205,000 with prices in the range of $50,000 to $355,000 and $215,000 as the median price value. These homes had on the average a little under 1500 square feet of living area, with just under 3 bedrooms and just under 1.6 full bathrooms on the average. These homes had been on the market for an average of 55 days, under 2 months, but the median ADOM value was only 15 days for these homes.
These 7 closings brought the number of homes sold for the quarter to 25, and for 2016 thus far to 63. For comparison, the average closing price for the 63 residential properties which closed in January through September 2016 (including the 7 discussed above) was just under $266,000 with $233,000 as the median closing price. Closing prices were in the $50,000 to $729,000 range. These homes had an average of just over 1700 square feet of living area and an average of just under 3 bedrooms and 1.7 full bathrooms; 30 (~48%) of these 63 homes had at least 1 half-bathroom. These homes had been on the market for an average of 74 days, just about 2.5 months, and the median number of days listed was 57 days – just under 2 months.
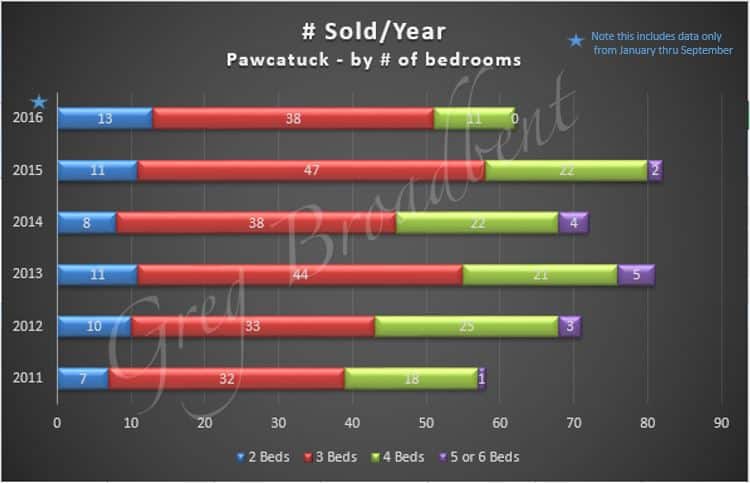
As far as longer term trends go, the graphs below show the number of homes sold per year since 2011, noting that there are only 3 quarters of data for 2016. The chart on the left below breaks down the number of homes sold by number of bedrooms for homes with 2-6 bedrooms.
|
|
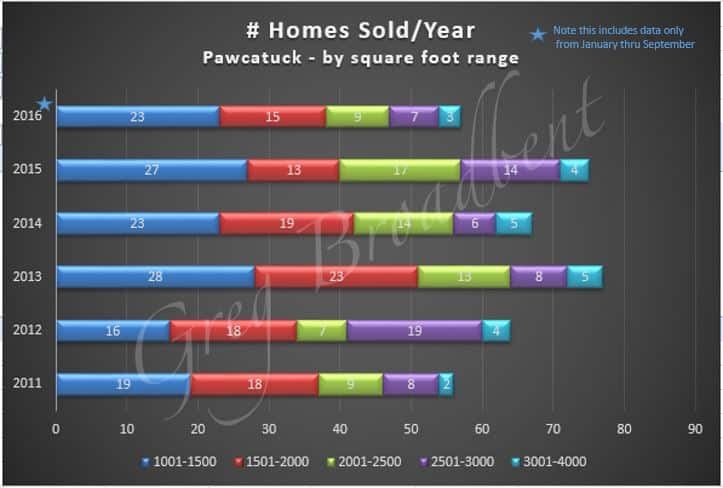
The chart on the right above breaks down the number of homes sold by living area range for homes which are between 1000 and 4000 square feet in size.
The chart below provides some information on trends in closing prices. It shows a 12-month quarterly “rolling average” of closing prices for homes sold over the past 5 years in total and broken down by number of bedrooms (for homes having 2-6 bedrooms). It suggests that after a decline in mid-2013, prices have held steady for homes with 2 and 3 bedrooms but have recovered and even improved for homes with a greater number of bedrooms.
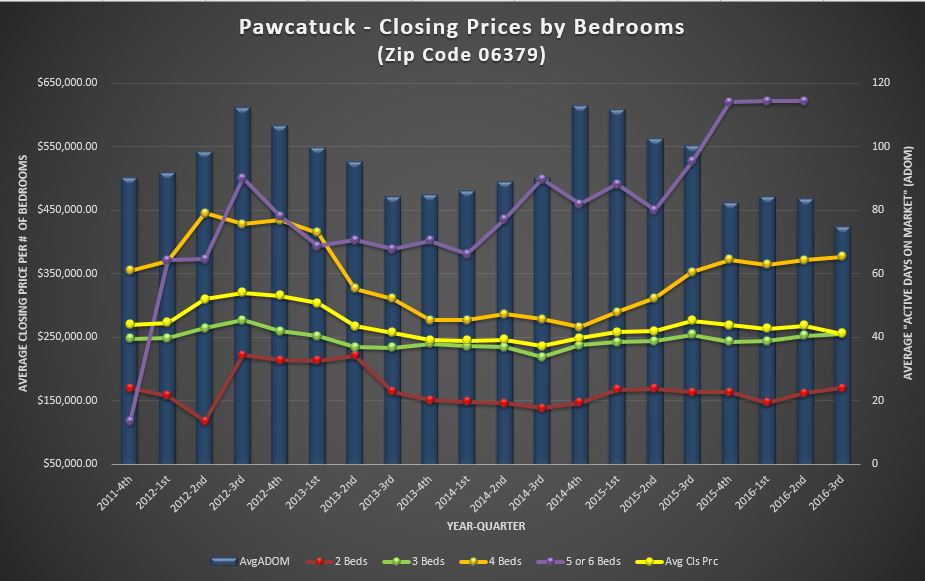
The chart above also shows a 12-month quarterly rolling average for “Active Days on Market” regardless of number of bedrooms. This suggests that the average time to sell a home has been fairly steady in a range of 80 to 110 days, although the ADOM has been on the lower end of that range for the last year or so.
We’ll be monitoring the market over the coming months to see if there are other trends or data of interest which we can share with you in future blogs.
The data reported above was taken from the CTMLS as of October 3rd 2016 for single family homes. Updated information will be posted on our Pawcatuck Real Estate Page. If you are looking for a home in Pawcatuck or if you would like to work with a local CT Realtor, please feel free to call us. We would love to help you buy or sell your next home.

